


Behavioral analysis is significant in the marketing world, but within this discipline, there are emerging areas that let us glean deeper insights into the mind of the user.
One such area is Cohorts.
What are cohorts?
They are time-bound groups of users segmented by attributes like age, gender, actions, and geography, among others.
Cohorts are not to be confused with segments.
For example, new users over the age of 50 is a segment, but new users over the age of 50 who joined in January is a cohort.
Similarly, all women above the age of 60 who have diabetes is a segment but all women above the age of 60 who have diabetes and started taking medication for it, 7 days ago, is a cohort.
One segment may have many cohorts.
With the help of data-crunching tools, businesses analyze cohorts to serve their customers better and drive more sales.
“But whoa! How do they do that?”, you may ask.
They do this by performing Cohort Analysis, the study of a specific kind of cohort. It is an analytic technique that maps engagement data from your customer’s actions on a dashboard for easy and concrete decision-making.
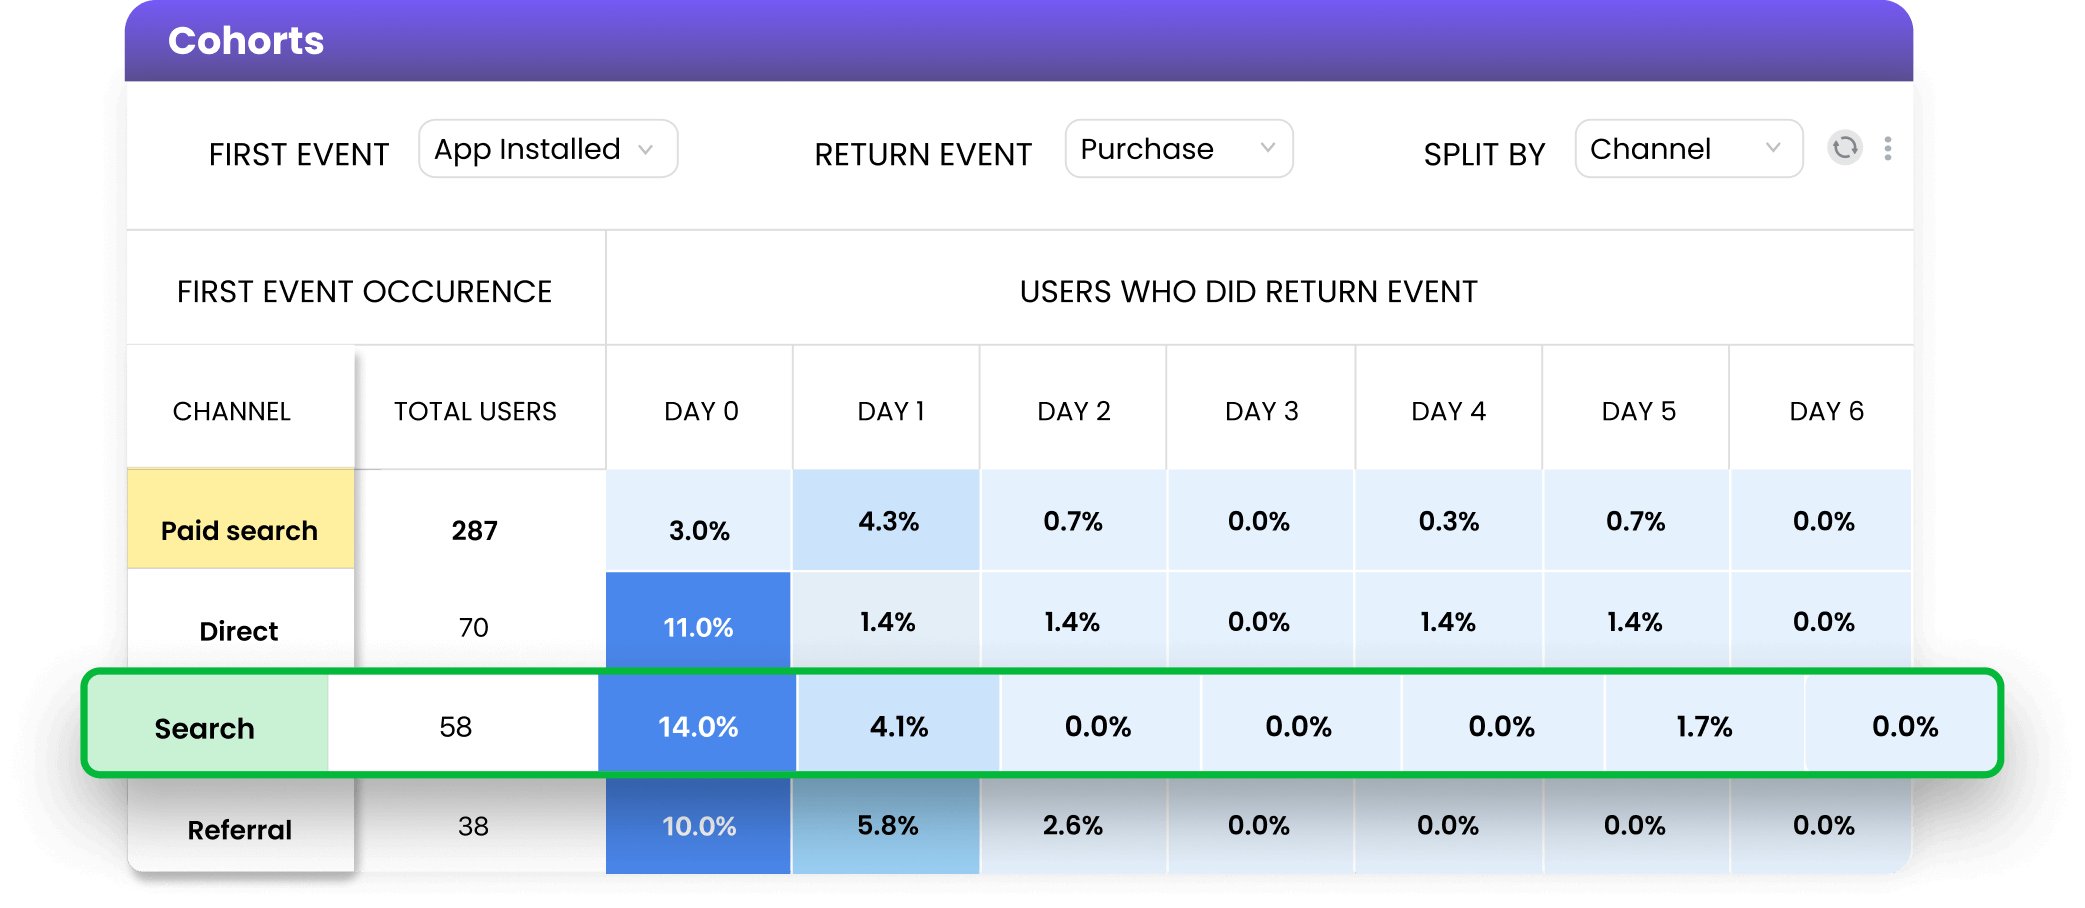
Just to give you an idea, here’s a cohort analysis table.
Why do we need cohort analysis?
Why pray tell, do we need cohort analysis despite other forms of graphs?
To improve retention, of course!
Cohort analysis strips down customer engagement data to a bare-bones version to cast a comprehensive view of their behavior across your marketing channels and present the information in a nutshell.
The depth of cohort analysis and its underlying features vary from product to product, but at its core, the data is meant to tell you what’s going right, what’s going wrong, where the drop-offs are happening, who’s abandoning your cart, and why customers aren’t returning for a repeat purchase.
How does cohort analysis work?
Cohort analysis is offered either as a standalone service or as part of a suite of applications. The popular providers that provide this service are Google and WebEngage.
Cohort Analysis visually represents data gathered from an app or website on a chart, table, or both.
Some growth metrics it gauges are conversion rates, goal completions per user, page views per user, revenue per user, sessions per user, session duration per user, and transactions per user.
There are 4 steps in the creation of cohorts.
Four steps of cohort creation
- Extraction: In this stage, raw data is extracted from a database and exported to a spreadsheet, where user attributes can be joined and further segmented.
- Creation: After extracting raw data, user data is bucketed into groups, such as app installed, uninstalled, date of installation, OS platform, etc.
- Calculation: After the creation of cohorts, each customer and the time between their corresponding actions is used for calculating lifecycle stages.
- Representation: Lastly, the data is sliced and diced using pivot tables and graphs to represent the data for the final analysis visually.
Since we understand the creation process, let’s move on to the types of Cohorts.
Two types of cohorts
- Acquisition cohorts: Grouped by when they signed up for your product/service and then tracked based on daily, weekly, or monthly metrics.
- Behavioral cohorts: Grouped by their triggers and actions on the product/services within a timeframe. These actions include but are not limited to app installed, uninstalled, added to cart, made a purchase, etc.
Analyze a cohort
Now that you have a rudimentary understanding of cohort analysis, let’s analyze a cohort, shall we?
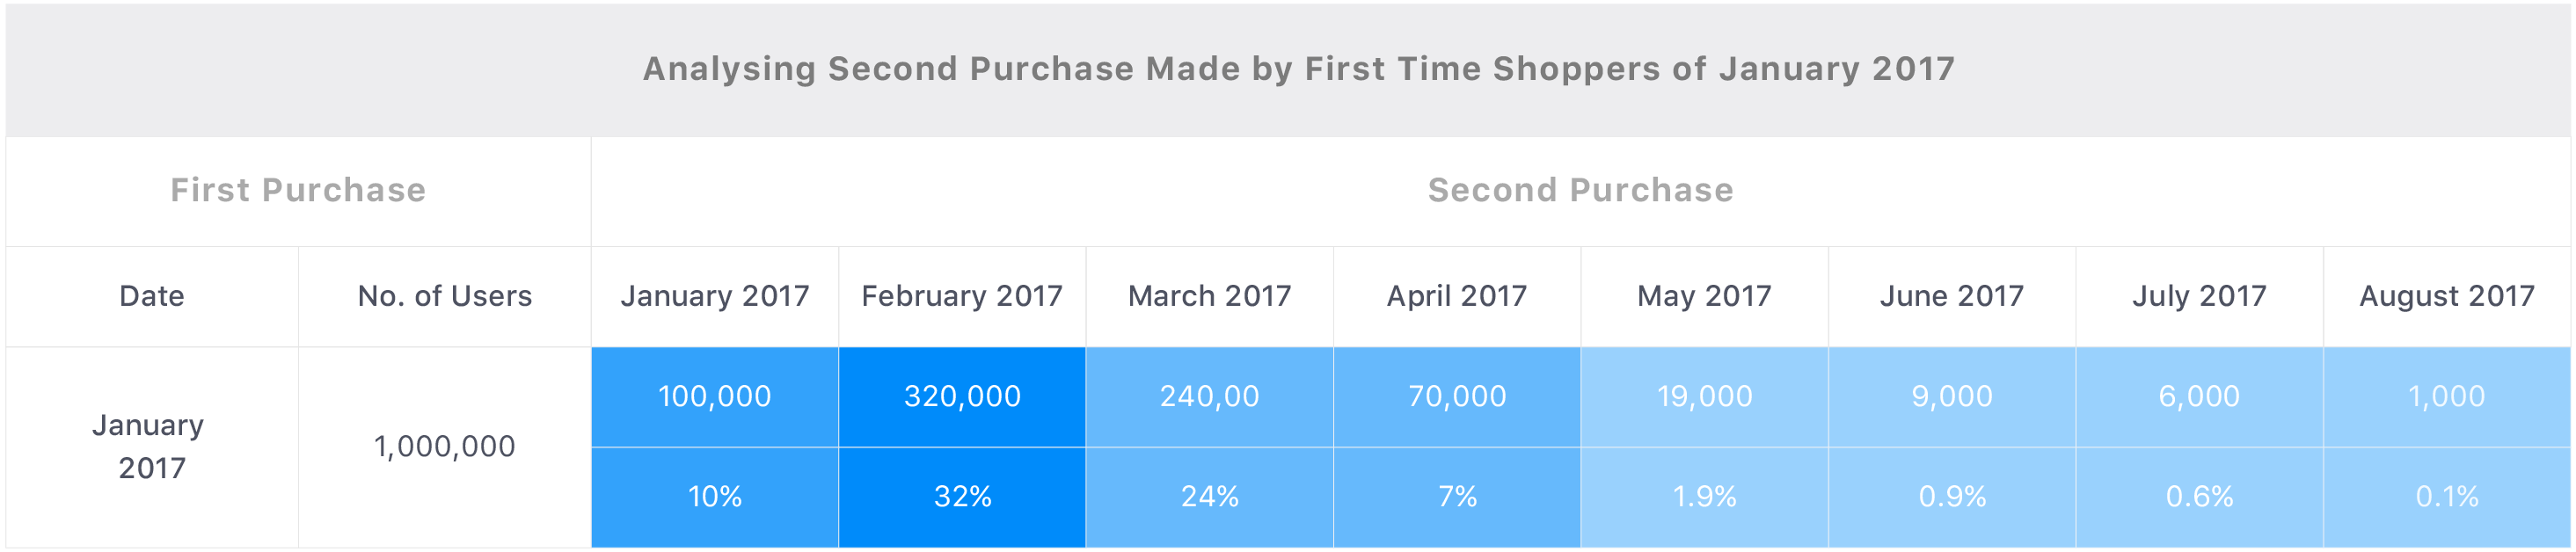
Each row above represents the repeat purchase behavior pattern of that cohort.
The row with January 2017 under the first column represents a cohort.
Similarly, the row with February 2017 represents another cohort.
Let us break this down for you with a detailed explanation of the analysis.
Going by the data, maximum repeat purchases (32%) were made in February 2017 by all the customers you acquired in January 2017.
Further, the table also reveals that maximum customers made a second purchase a month after their first purchase (You can see this under the column, Month 1, which shows the highest values compared to the other columns).
This implies that most of your users felt the need to reorder a product or make another purchase a month after their first purchase. Thus, as a marketer, your job will be to reduce this time gap and drive more purchases.
Even though March 2017 recorded the lowest number of first-time shoppers (compared to the other cohorts), these shoppers recorded the highest repeat purchase rate within the same month (17% is the highest among the values under Month 0).
This implies that even though you acquired less number of customers in March 2017, the cohort included many high-intent customers who found great utility for your e-commerce site.
And that is how you analyze a cohort table.
We can’t wait to see what you do with cohorts. All the best!
Conclusion
Simply put, cohort Analysis is the study of a specific kind of time-bound user segment to measure and map customer engagement data on a table or a chart for swift decision-making. It strips down customer engagement data to a bare-bones version to cast a comprehensive view of their behavior across your marketing channels and present the information in a nutshell. From creating, dividing, and analyzing, there’s a lot, cohort analysis data can bring to the fore.
