Products Analytics

Every user action
is a signal

We track all of it, across every touch point, and turn it into intelligence. Leverage self-serve analytics to improve user experience and create lasting customer relationships.

Six surfaces. Myriad capabilities.

Every surface answers a different question about your users. Each section below opens with the question it settles.

Track any action users take, and how often

Slice events by product categories, channels, campaigns, and more

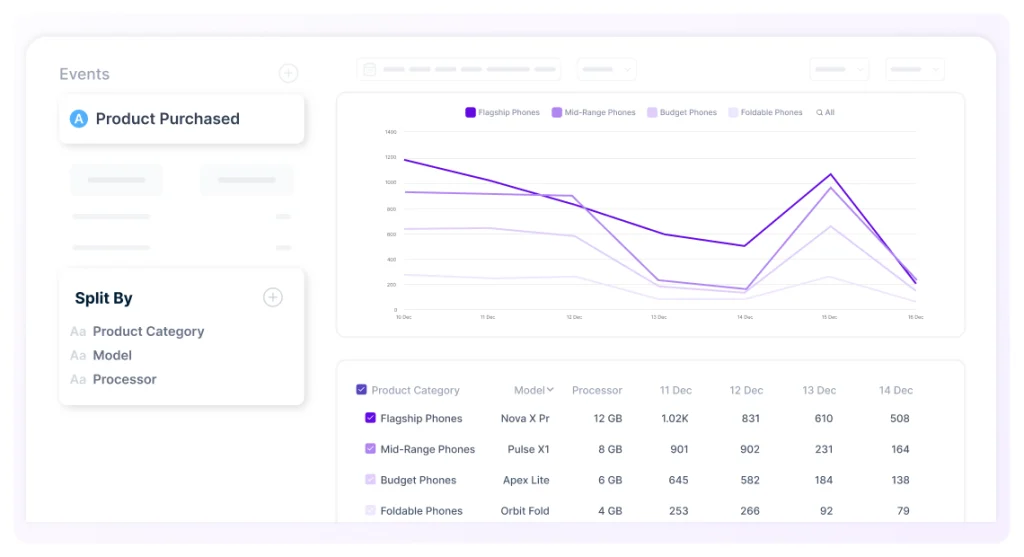
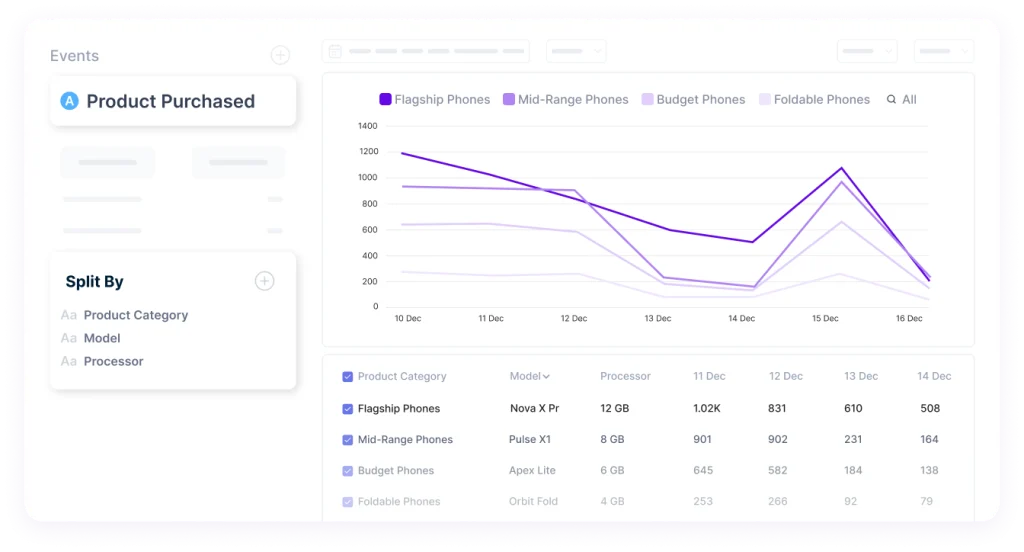
Break down any event by its attributes to compare trends across segments. For example, analyze how “Product Purchased” performs across Product Category, Model, or Processor over time.

Build multi-event charts to see what drives conversions

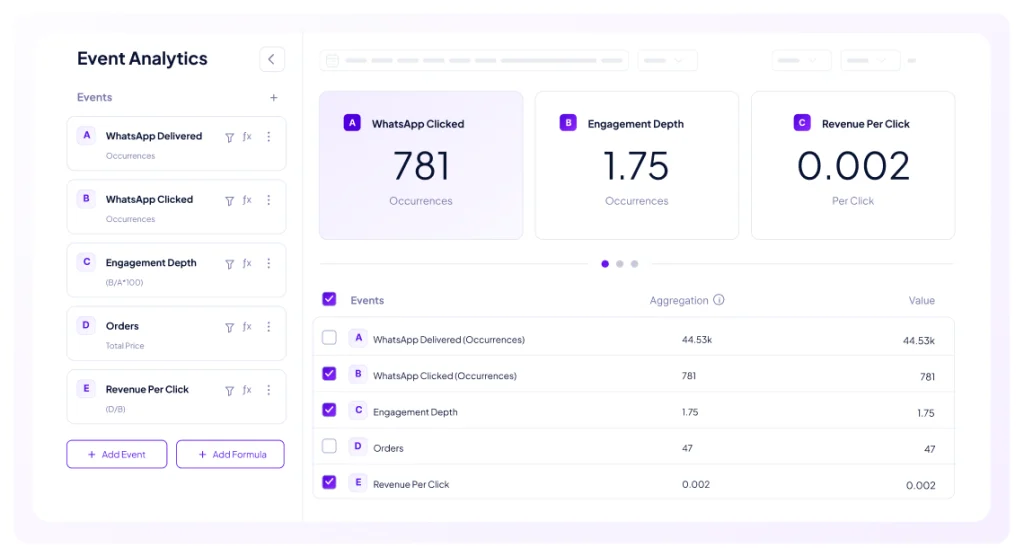
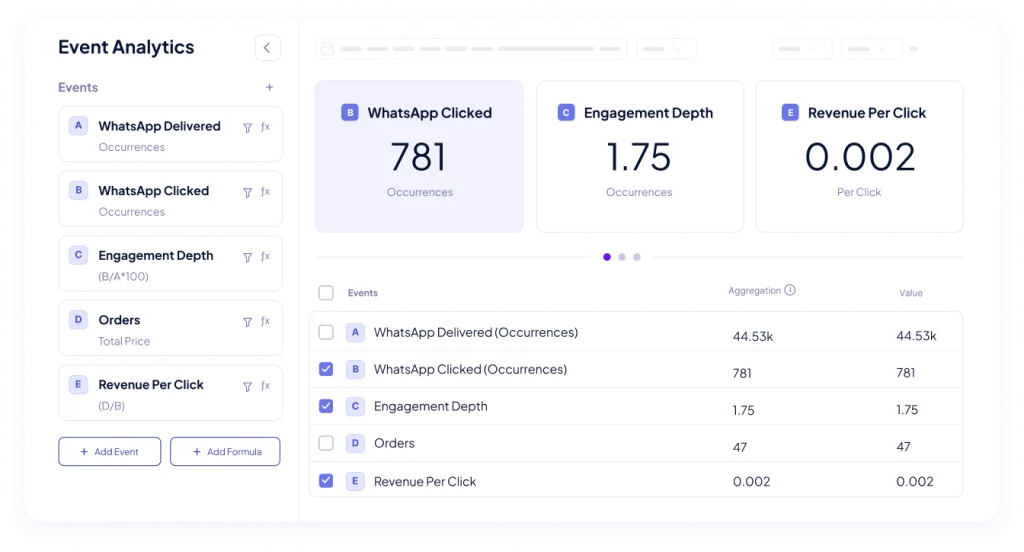
Measure and combine user events with custom formulas to turn raw occurrences into actionable insights. Create interactive charts, and seamlessly pin them to the dashboard.

Create Static or Refreshing Lists from any insight with just a click

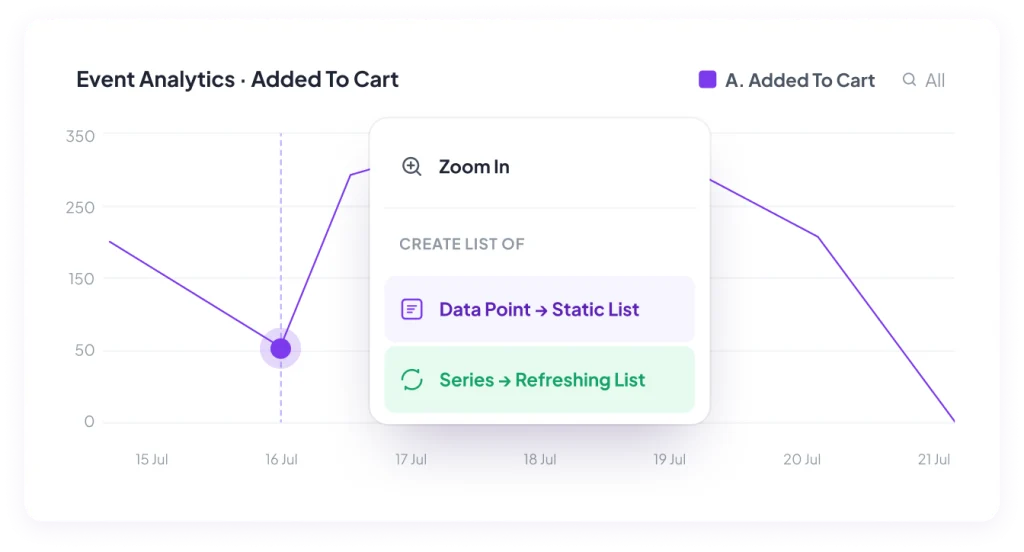
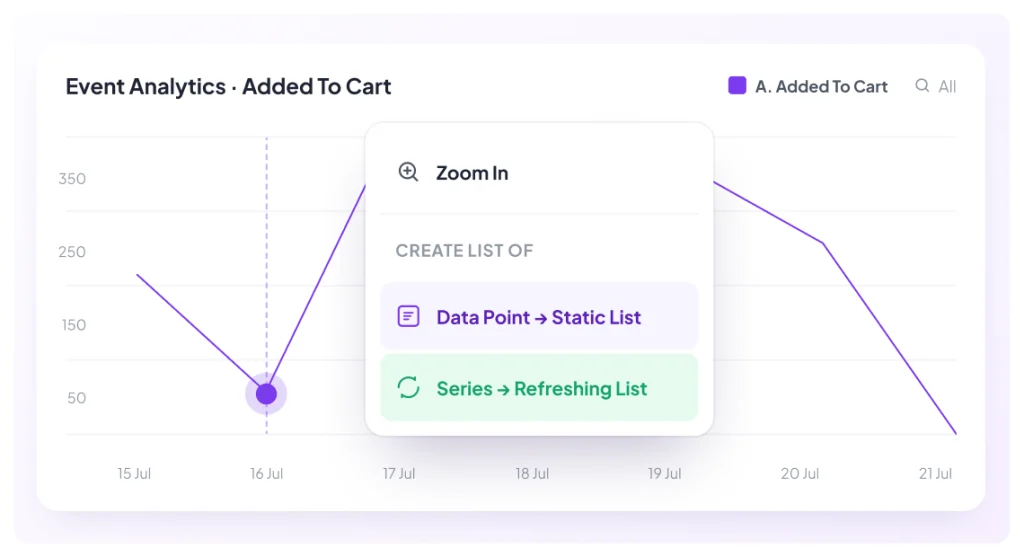
Turn any chart selection into a targetable user list. For example, click a data point on “Added To Cart” to build a static list, or a series for a refreshing one.

Follow the routes users take, and where they wander off

See exactly where users go before and after any key event in their journey

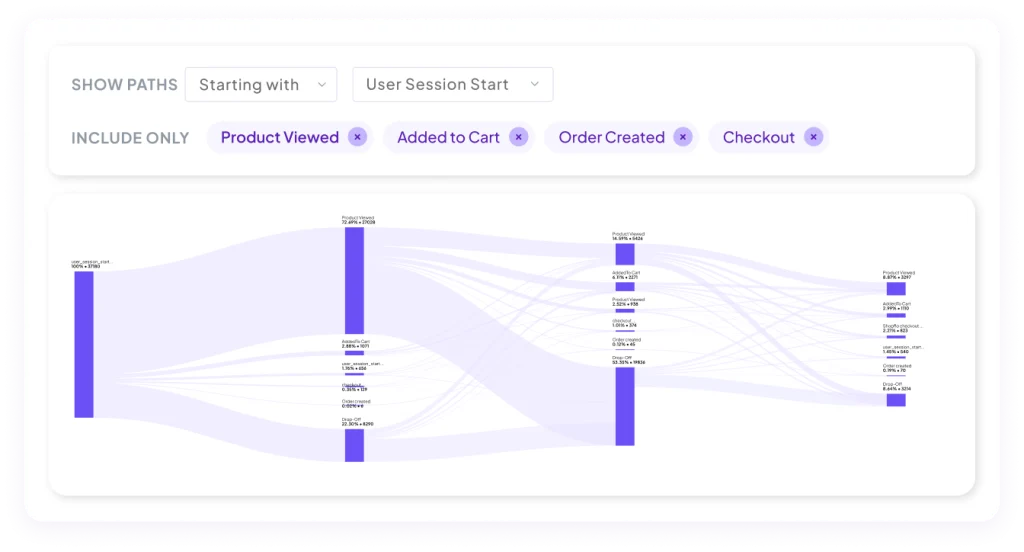
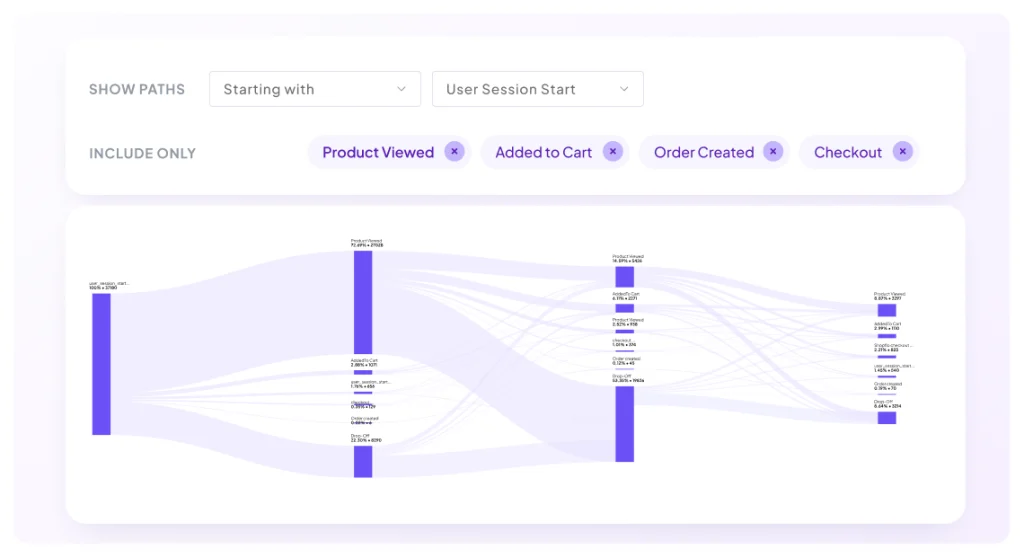
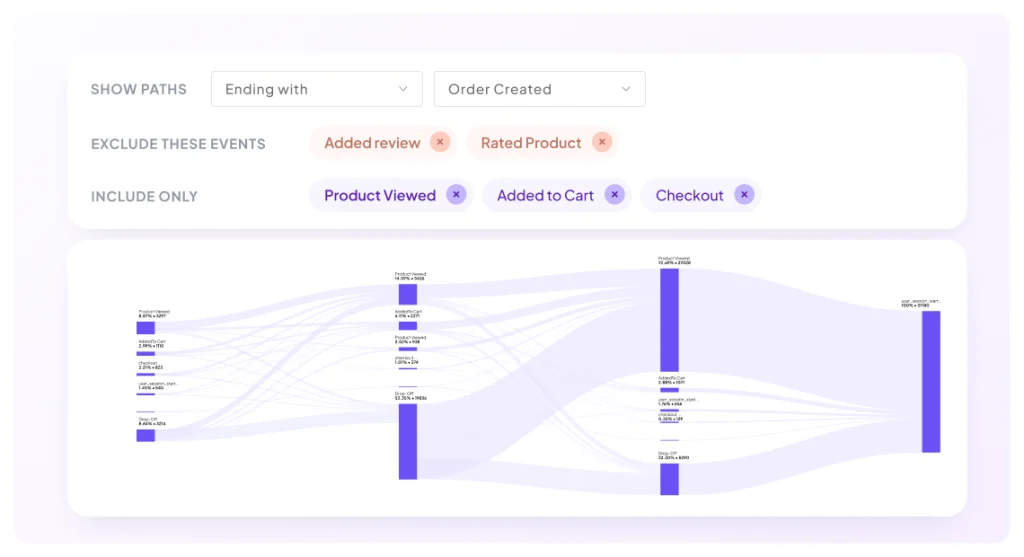
Visualize how users move through your product as a flowing Sankey diagram. Start from any event, include only the steps that matter, and pinpoint where users convert, detour, or abandon.

Strip out irrelevant events to reveal the paths that actually matter

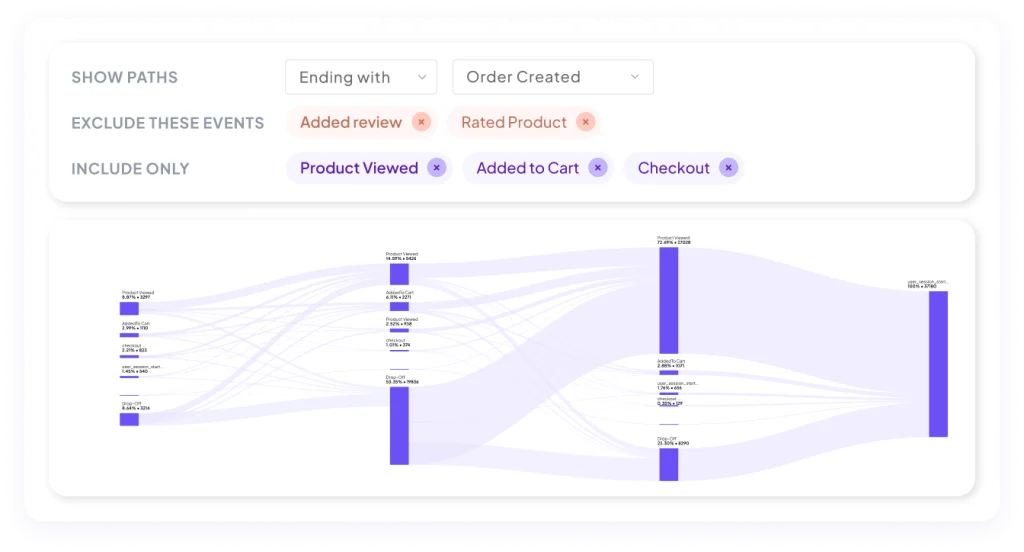
Filter out noisy, distracting steps from your path analysis so only meaningful events remain, giving you the clearest possible view of the route users take toward conversion.

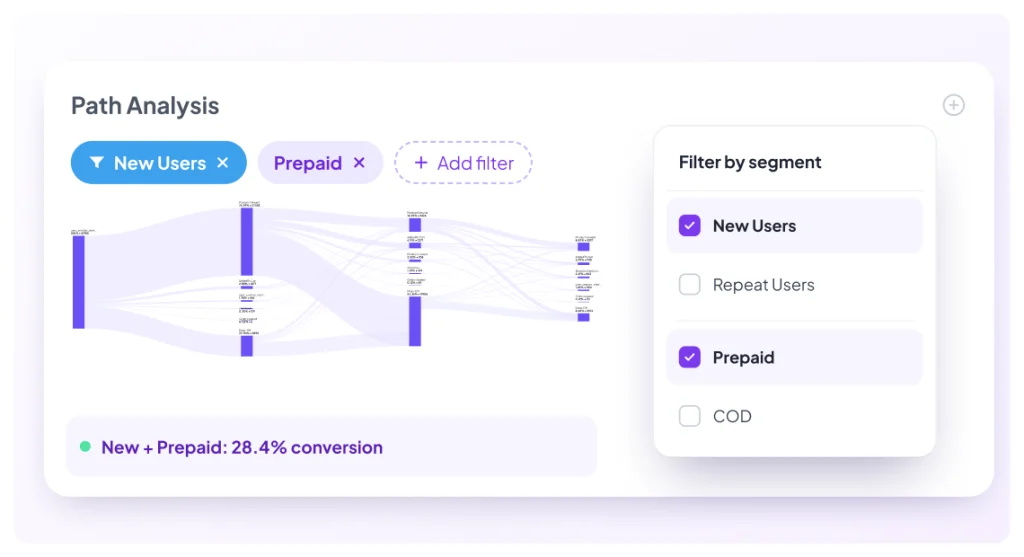
Narrow your path flow to any user segment to see how they really convert

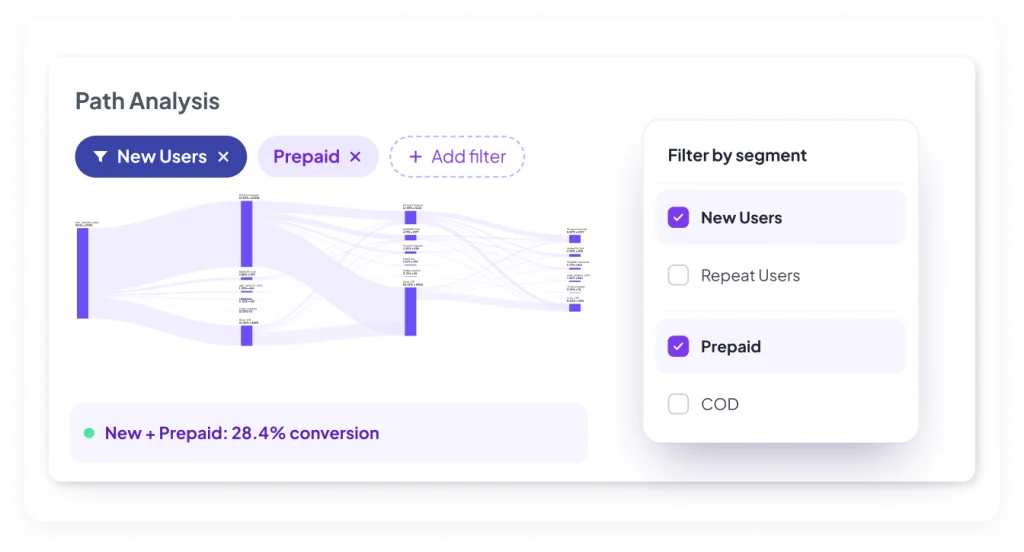
Apply segment filters to your path analysis and watch how a specific cohort navigates. Additionally, combine multiple segments to isolate how that combined group converts and where it drops off.

Measure conversion step by step, and spot the leak

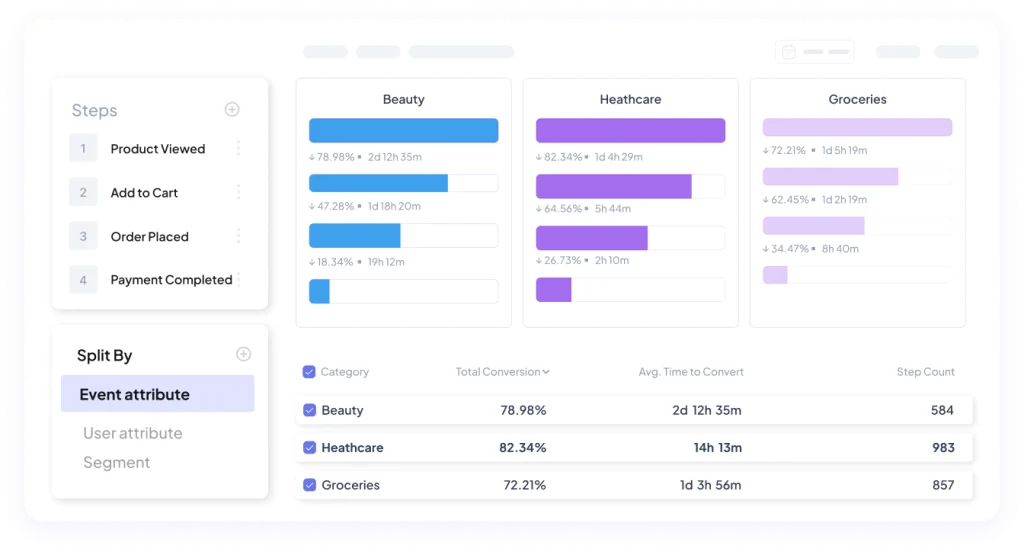
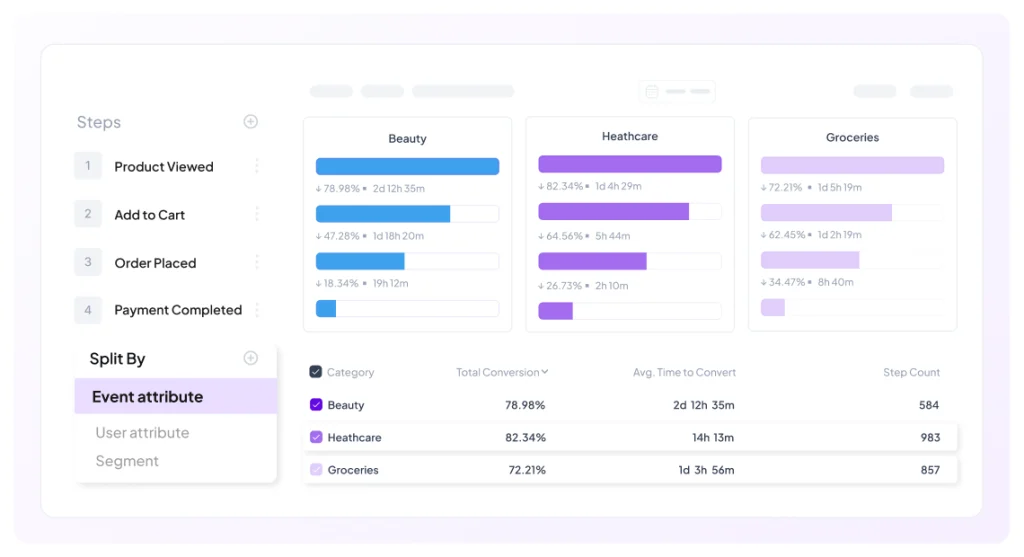
Split Funnels by user attributes, event attributes & segments

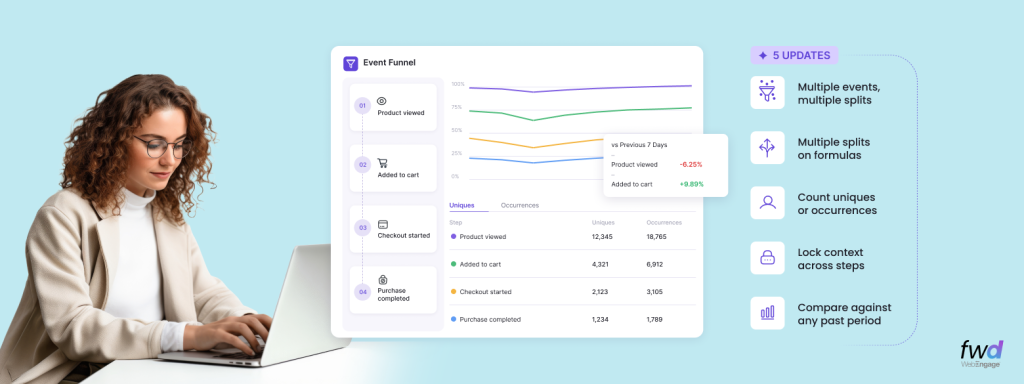
Split any conversion funnel by event attribute, user attribute, or segment to compare groups side by side. See which converts best and where each drops off.

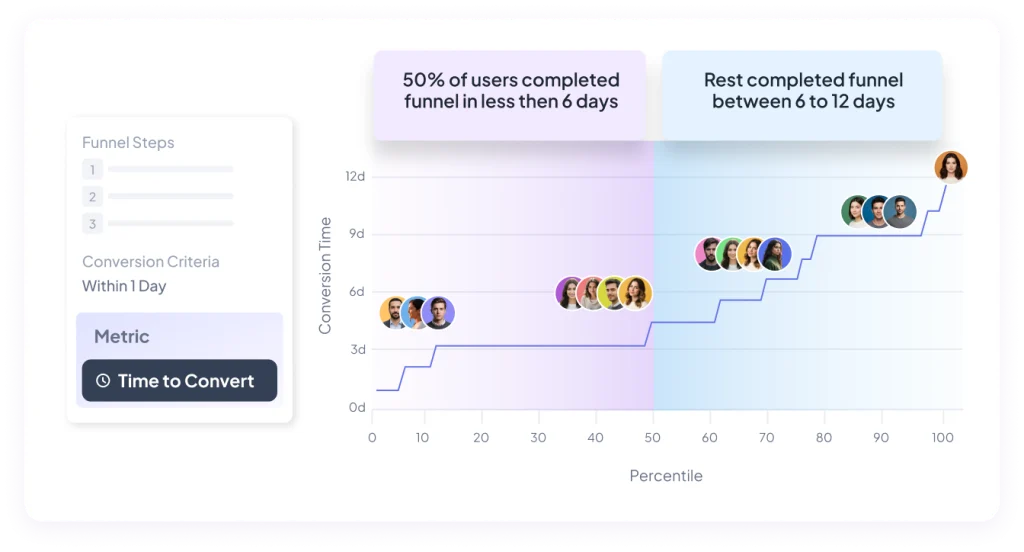
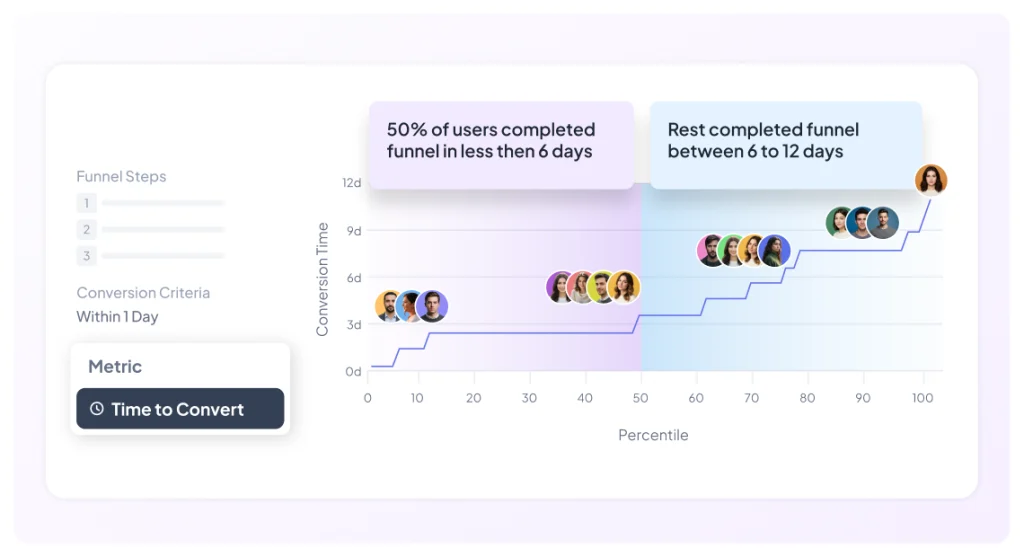
Analyze how quickly different user percentiles complete a conversion

Go beyond averages to see the full distribution of conversion time across percentiles. Learn how fast your quickest users convert and how long the slowest tail takes.

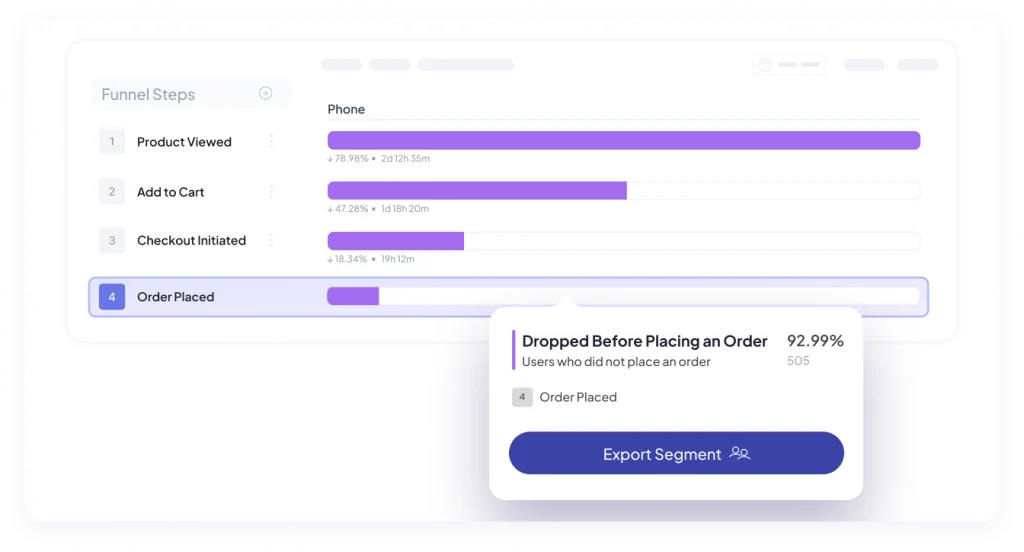
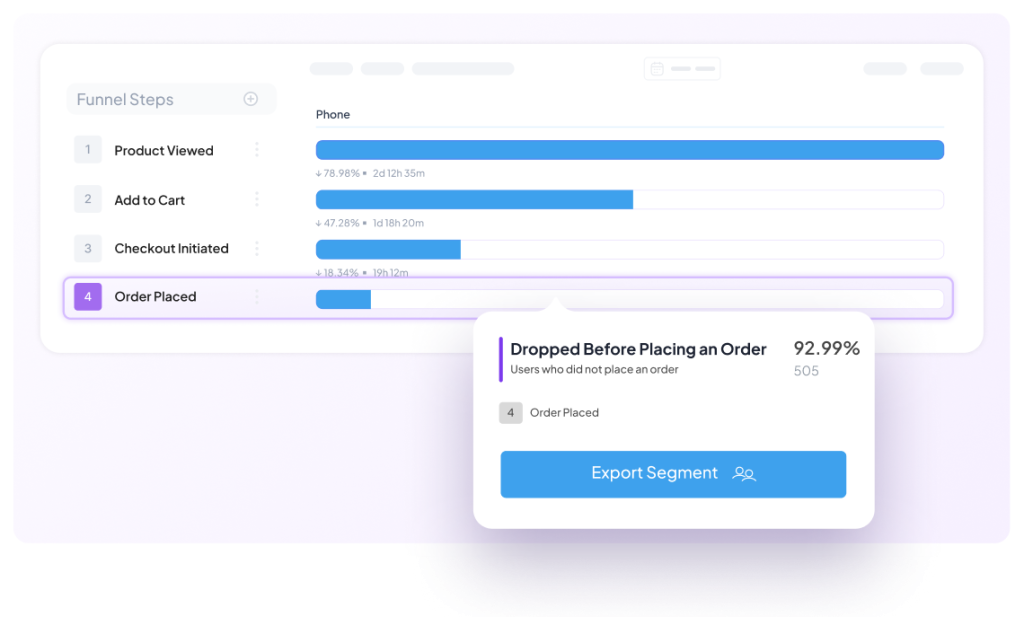
Create segments right from funnels for retargeting or win‑back campaigns

Export users from any funnel stage as a segment. Retarget dropped-off users with win-back campaigns, or run upsell campaigns for the users who made it through.

See how many users stick around week after week

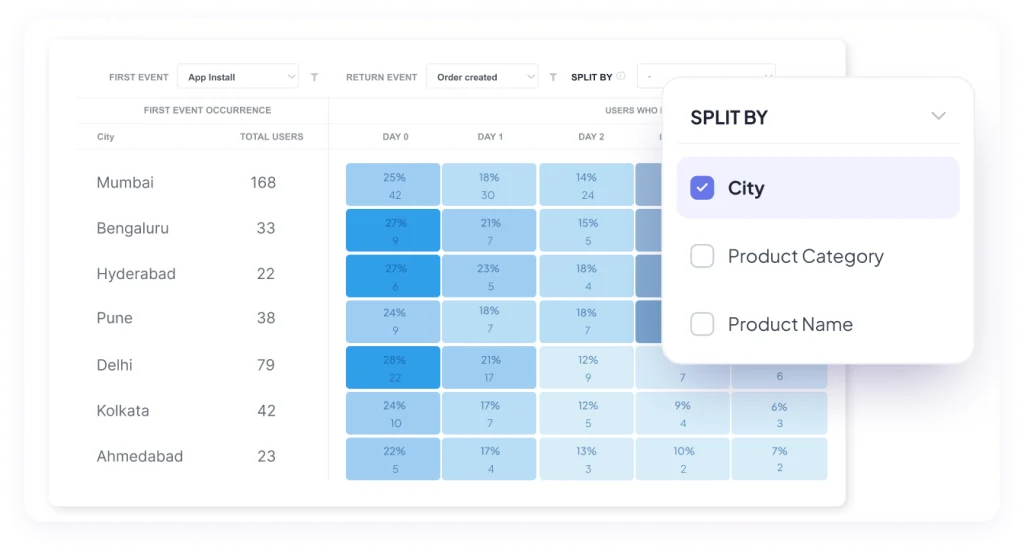
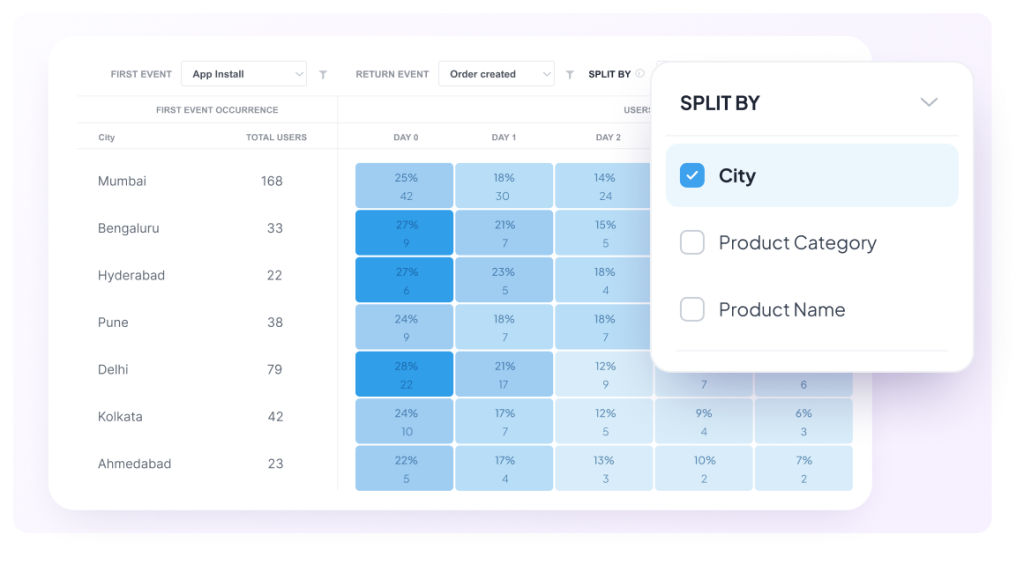
See exactly which user segments keep coming back after their first action

See how many users return to complete a key action over days or weeks after their first event, and break cohorts down by city, product, or any attribute to uncover what drives retention.

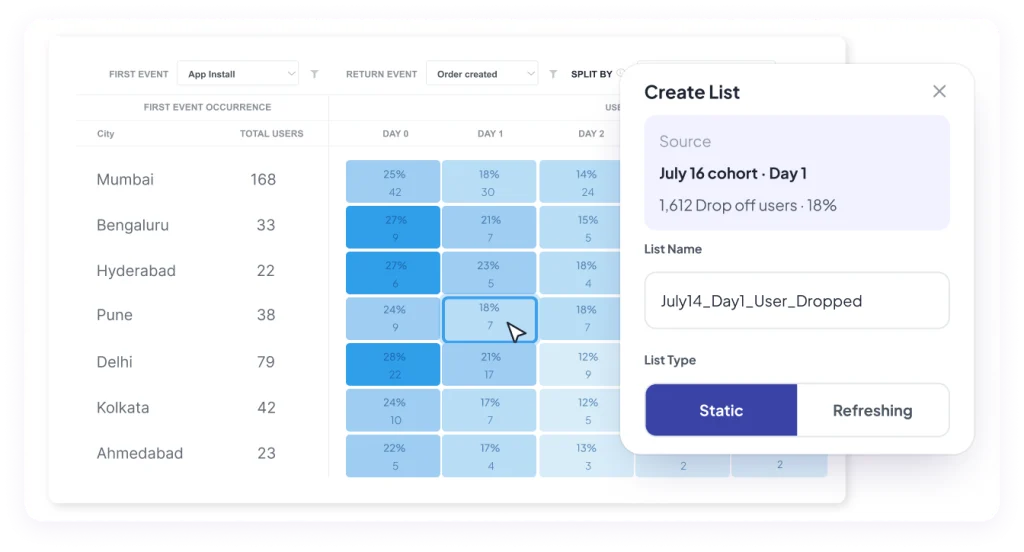
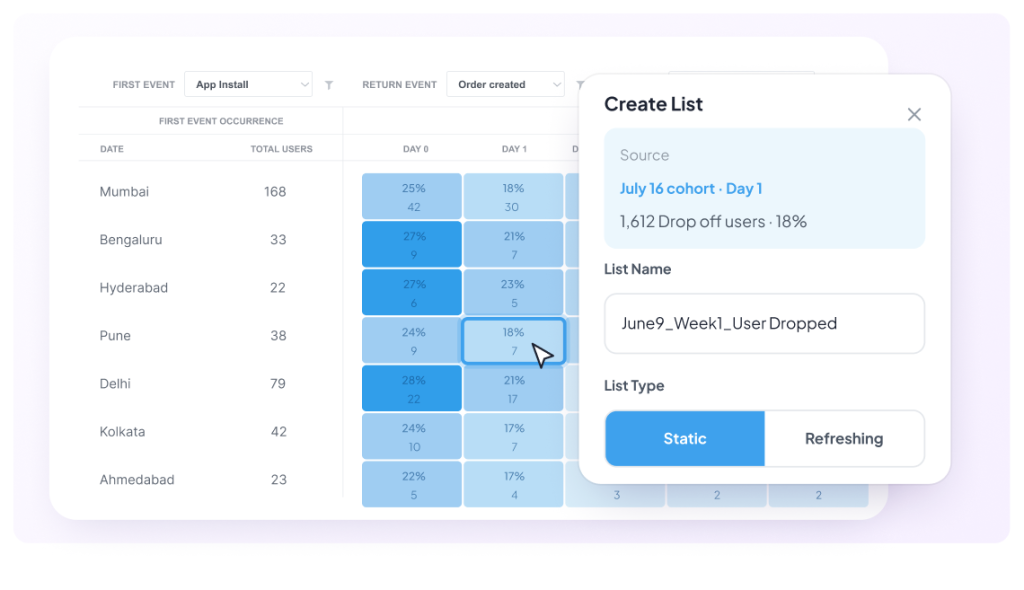
Turn any retention cohort into a targetable audience in one click

Click any cell in the grid, like the users who dropped off on Day 2, to instantly build a static or auto-refreshing list you can target and re-engage across channels.

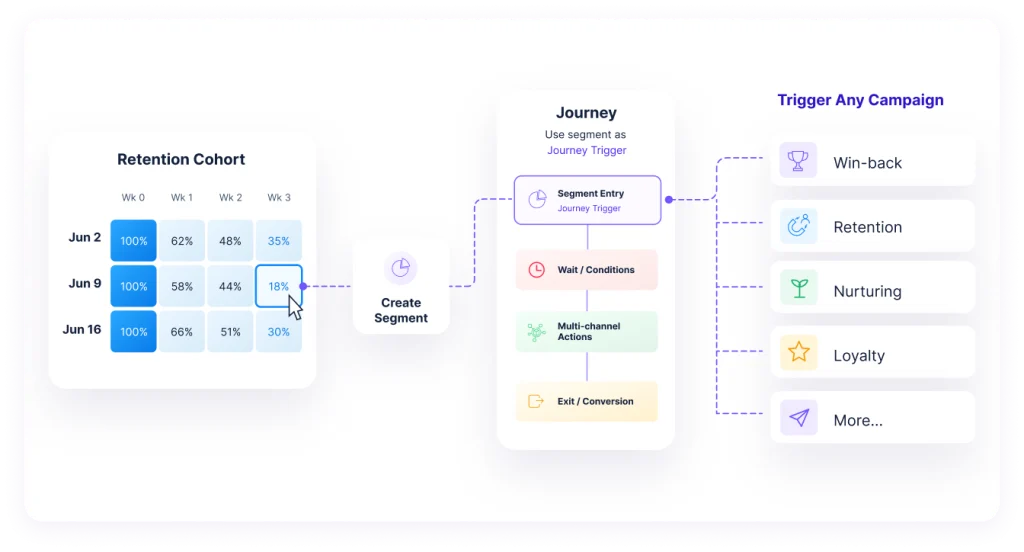
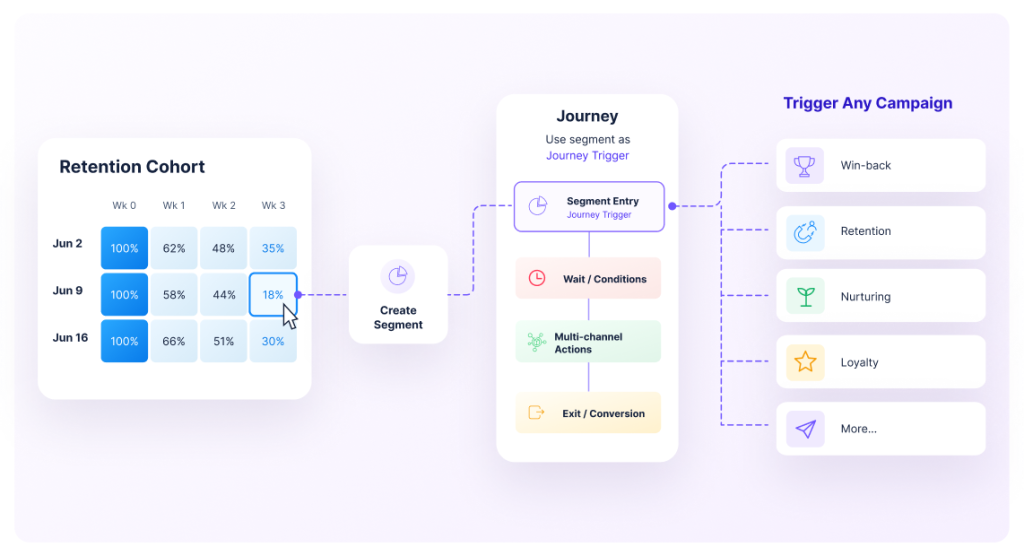
Turn retention cohorts into targeted journeys that re-engage at-risk users

Isolate any cohort cell, turn those users into a segment, and trigger multi-channel journeys. For example, target Week 3 drop-offs with an automated win-back campaign.

Rank users by recency, frequency, and spend

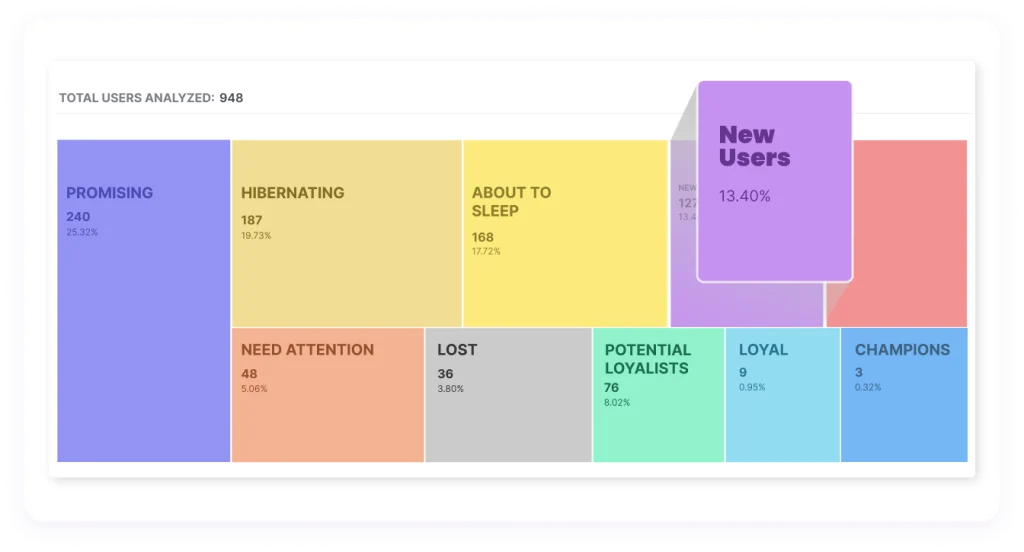
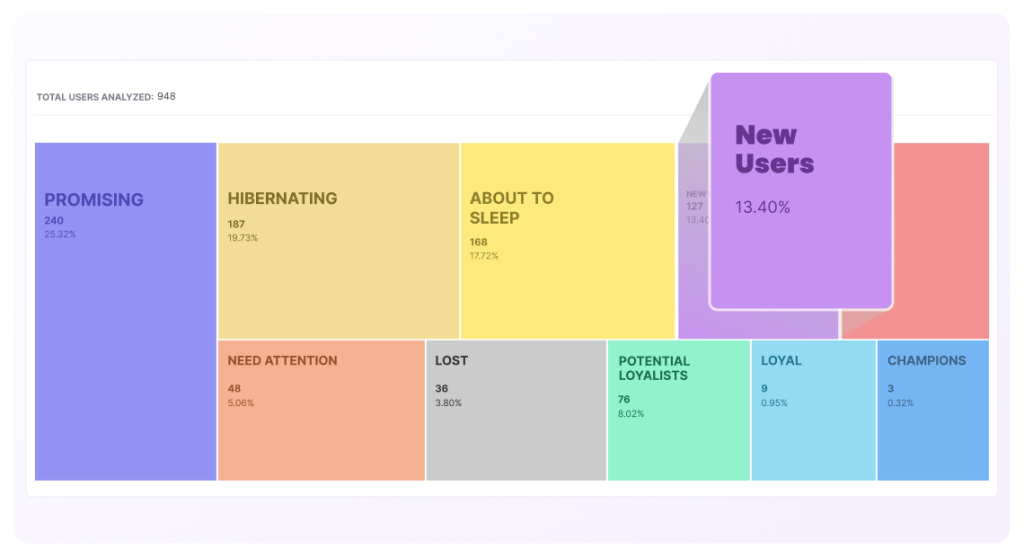
Automatically sort every user into behavioral segments, from champions to at-risk

Group your entire user base by how recently, often, and how much they engage, into segments like Champions, Loyal, and Hibernating. Instantly spot who to reward, who to win back.

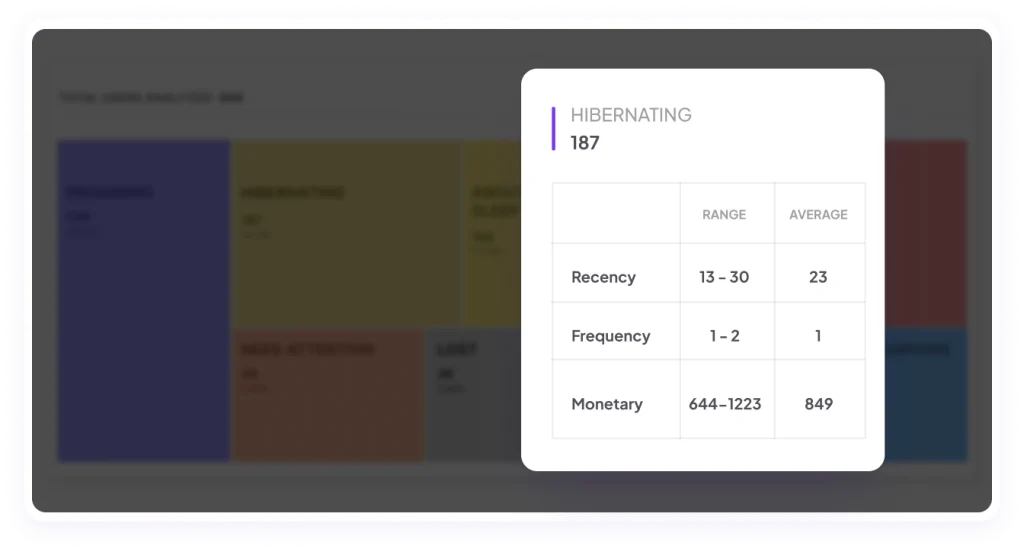
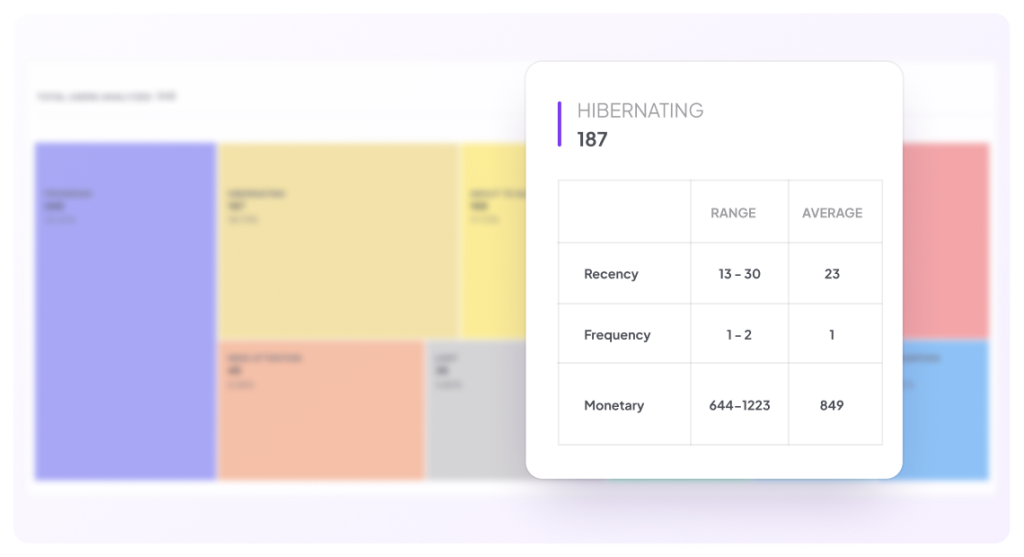
See the exact Recency, Frequency, and Monetary scores behind every segment

Drill into any RFM segment to see their recency, frequency, and monetary ranges. For example, Hibernating users last purchased 13–30 days ago, bought just 1–2 times, yet spent meaningfully.

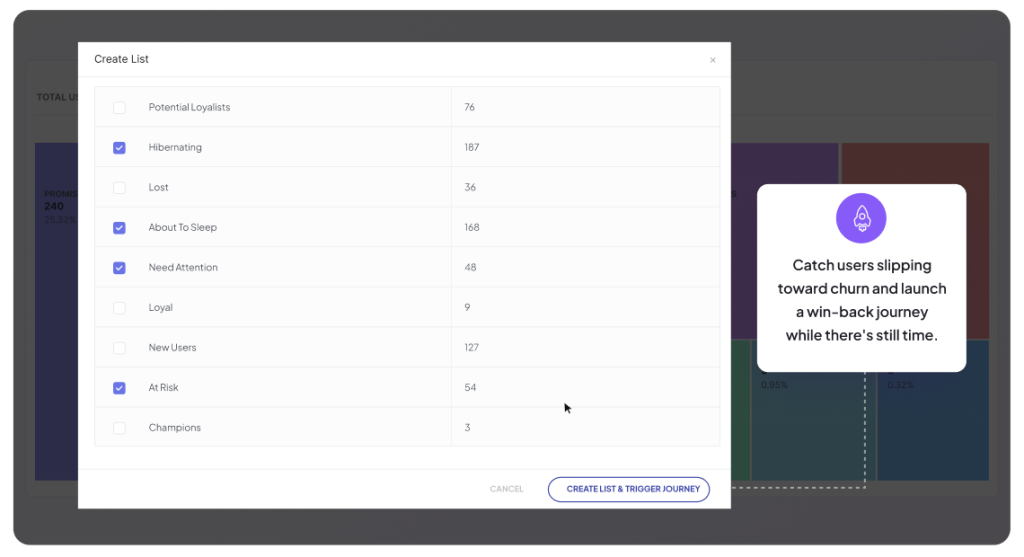
Turn your at-risk RFM segments into a win-back journey before they churn

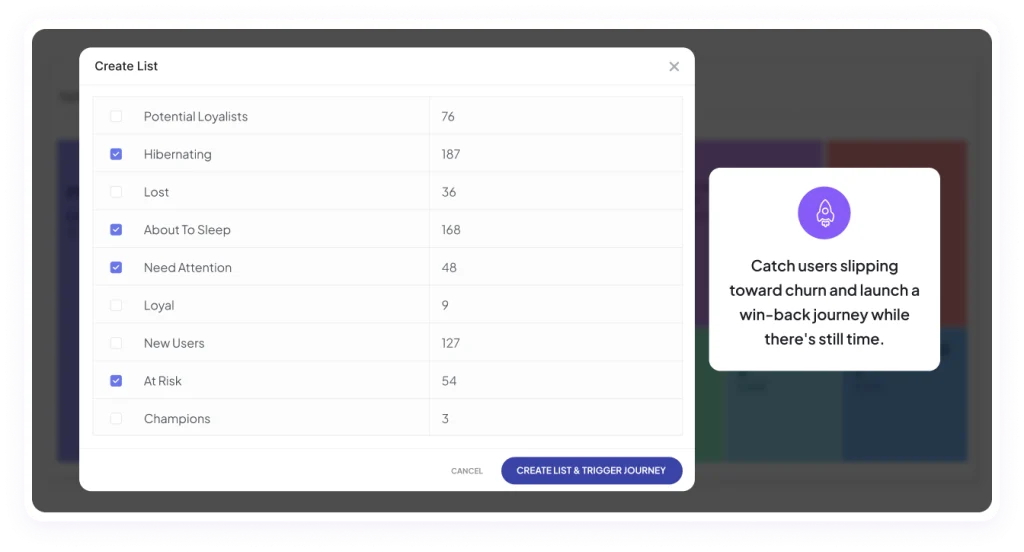
Bundle churn-risk segments like Hibernating, At Risk, and Need Attention into a single refreshing list, then trigger a win-back journey, so slipping users are re-engaged automatically.

Learn who churned and what they did just before

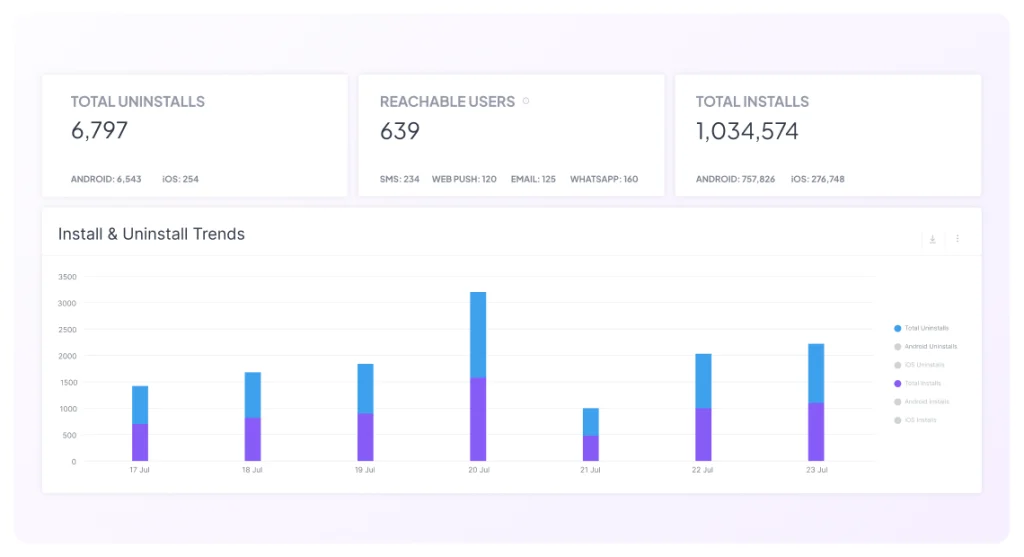
Check your app install and uninstall trends over a selected time frame

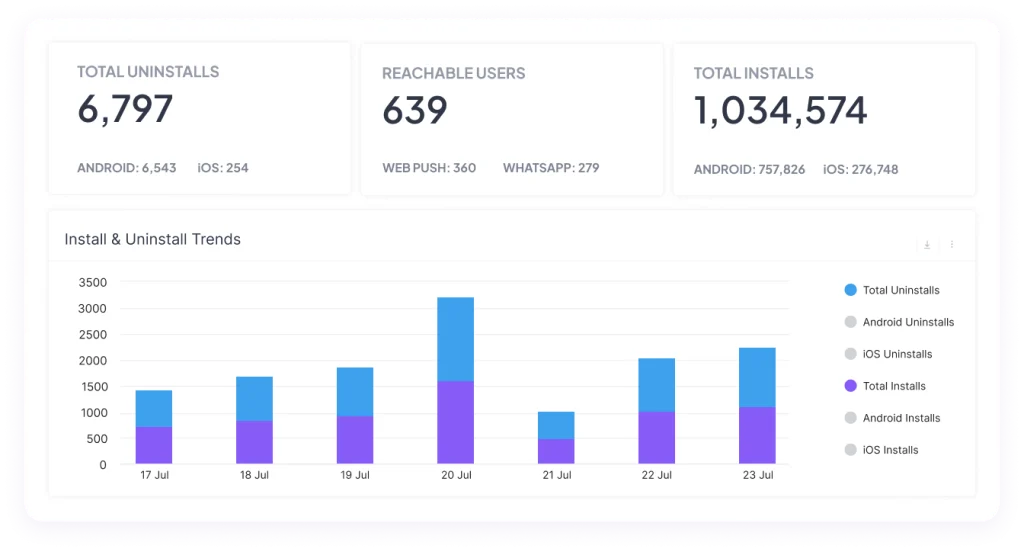
Track app uninstalls across Android and iOS, uncover what’s driving churn, and see which lost users are still reachable via SMS, WhatsApp, or web push, so you can win them back.

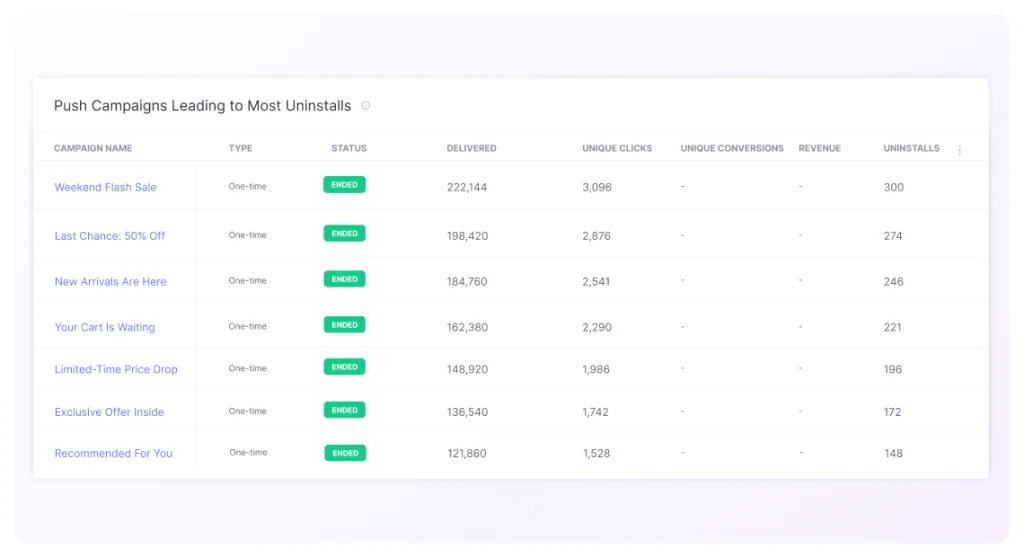
Pinpoint the exact push campaigns nudging users to delete your app

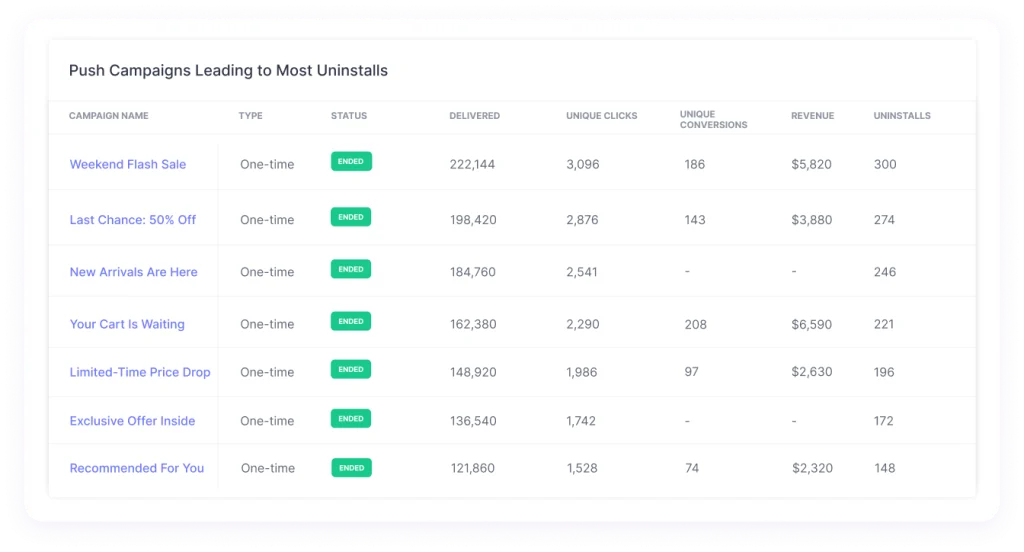
See which push notifications trigger the most uninstalls, ranked alongside delivery, clicks, and conversions. Spot over-messaging or off-target campaigns that are quietly driving users away.

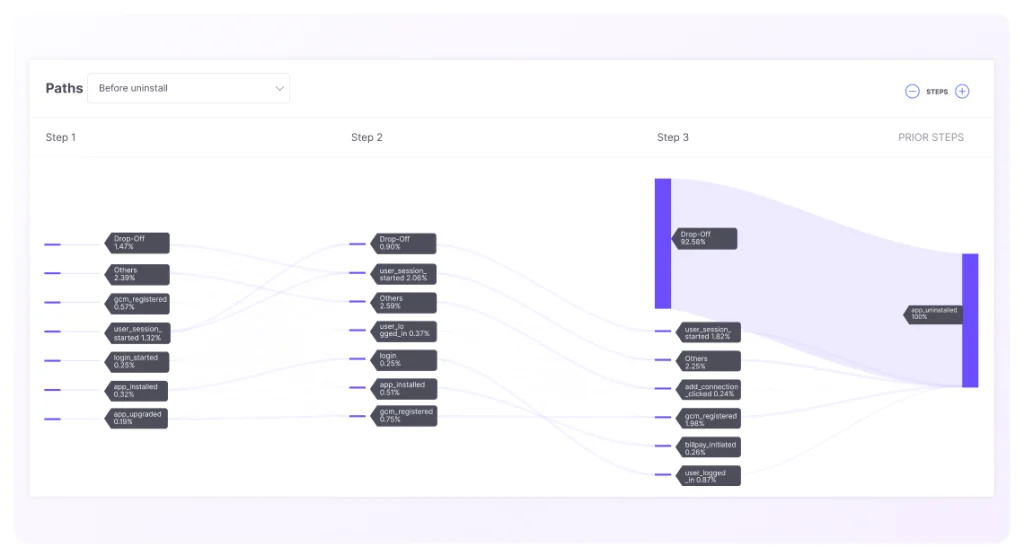
Seamlessly visualize what users do before they uninstall your app

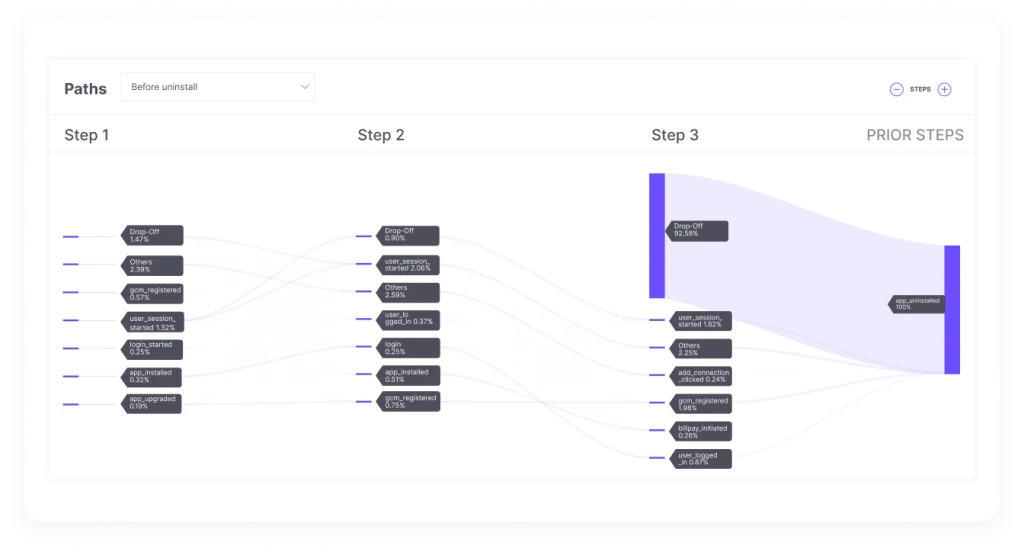
Work backward from the uninstall event to reveal the actions and drop-offs leading up to it. Easily surface the friction points that push users toward deleting your app.
Six surfaces. Myriad capabilities.

Slice events by product categories, channels, campaigns, and more

Break down any event by its attributes to compare trends across segments. For example, analyze how “Product Purchased” performs across Product Category, Model, or Processor over time.

Build multi-event charts to see what drives conversions

Measure and combine user events with custom formulas to turn raw occurrences into actionable insights. Create interactive charts, and seamless pin them to the dashboard.

Create Static or Refreshing Lists from any insight with just a click

Turn any chart selection into a targetable user list. For example, click a data point on “Added To Cart” to build a static list, or a series for a refreshing one.

See exactly where users go before and after any key event in their journey

Visualize how users move through your product as a flowing Sankey diagram. Start from any event, include only the steps that matter, and pinpoint where users convert, detour, or abandon.

Strip out irrelevant events to reveal the paths that actually matter

Filter out noisy, distracting steps from your path analysis so only meaningful events remain, giving you the clearest possible view of the route users take toward conversion.

Narrow your path flow to any user segment to see how they really convert

Apply segment filters to your path analysis and watch how a specific cohort navigates. Additionally, combine multiple segments to isolate how that combined group converts and where it drops off.

Split Funnels by user attributes, event attributes & segments

Split any conversion funnel by event attribute, user attribute, or segment to compare groups side by side. See which converts best and where each drops off.

Analyze how quickly different user percentiles complete a conversion

Go beyond averages to see the full distribution of conversion time across percentiles. Learn how fast your quickest users convert and how long the slowest tail takes.

Create segments right from funnels for retargeting or win‑back campaigns

Export users from any funnel stage as a segment. Retarget dropped-off users with win-back campaigns, or run upsell campaigns for the users who made it through.

See exactly which user segments keep coming back after their first action

See how many users return to complete a key action over days or weeks after their first event, and break cohorts down by City, product, or any attribute to uncover what drives retention.

Turn any retention cohort into a targetable audience in one click

Click any cell in the grid, like the users who dropped off on Day 2, to instantly build a static or auto-refreshing list you can target and re-engage across channels.

Turn retention cohorts into targeted journeys that re-engages at-risk users

Isolate any cohort cell, turn those users into a segment, and trigger multi-channel journeys. For example, target Week 3 drop-offs with an automated win-back campaign.

Automatically sort every user into behavioral segments, from champions to at-risk

Group your entire user base by how recently, often, and how much they engage, into segments like Champions, Loyal, and Hibernating. Instantly spot who to reward, who to win back.

See the exact Recency, Frequency, and Monetary scores behind every segment.

Drill into any RFM segment to see their recency, frequency, and monetary ranges. For example, Hibernating users last purchased 13–30 days ago, bought just 1–2 times, yet spent meaningfully.

Turn your at-risk RFM segments into a win-back journey before they churn

Bundle churn-risk segments like Hibernating, At Risk, and Need Attention into a single refreshing list, then trigger a win-back journey, so slipping users are re-engaged automatically.

Check your app install and uninstall trends over a selected time frame

Track app uninstalls across Android and iOS, uncover what’s driving churn, and see which lost users are still reachable via SMS, WhatsApp, or web push, so you can win them back.

Pinpoint the exact push campaigns nudging users to delete your app

See which push notifications trigger the most uninstalls, ranked alongside delivery, clicks, and conversions. Spot over-messaging or off-target campaigns that’s quietly driving users away.

Seamless visualize what users do before they uninstall your app

Work backward from the uninstall event to reveal the actions and drop-offs leading up to it. Easily surface the friction points that push users toward deleting your app.
What can WebEngage Analytics unlock for your role?

Find what converts, fix what doesn't

Find what converts, fix what doesn't

Find what converts, fix what doesn't

Additional Resources

WebEngage Is Now Salla Platform Native – Asia’s #1 CEP Joins Hands With GCC’s Largest E-commerce Platform

Salla is one of the largest commerce platforms in the GCC region, built specifically for merchants in the Middle East…

Analytics Digest – Introducing Multi-splits in Event Analytics, Choose Between Uniques/Occurrences In Funnels, Hold Property Constant In Funnels & Compare Funnels Across Time Periods

WebEngage is rapidly becoming the de-facto Analytics toolkit for its customers across product and growth teams. As our usage grows…
Analytics that answers why, not just what

platform

Platform

Zero PII

No personal data stored.

AI-Powered

Atlas AI

AI-powered customer engagement suite.

Capabilities

Customer Data Platform

Your schema, your engagement rules

Automation

Automate workflows, orchestrate growth

Segmentation

Precise user segmentation, simplified

Personalization

Smarter web and app personalization

Analytics

Deeper analytics, sharper decisions

Recommendations

Context-aware recommendations that sell

Solutions

Travel & Hospitality

Healthcare

Automotive

Insurance

E-commerce and Retail

Resources

Product Releases

Ebooks

Blogs

Newsroom

Webinars

EngageMint

Impact Stories

Glossary

FEATURED

Introducing Entity Relationship Visualizer – Manage Relationships Between Your CDPx Data Objects In A Visual Interface

Winning Back Users: Proven Retargeting & Deep Linking Strategies.

Products

Platform

Zero PII, Black, Composable CDP

Capabilities

CDP, Segmentation, Analytics & more

Channels

Mobile, Email, WhatsApp, SMS & More

Solutions

BLACK

Resources