
Funnel Analytics is one of the most widely used feature within WebEngage. Given how growth teams analyse their user journeys and product funnels on the dashboard, we have been rapidly iterating on this module. If you live and breath Funnels, this improvement is dedicated to you 🙏
Add Multiple Events to a Step in the Funnel
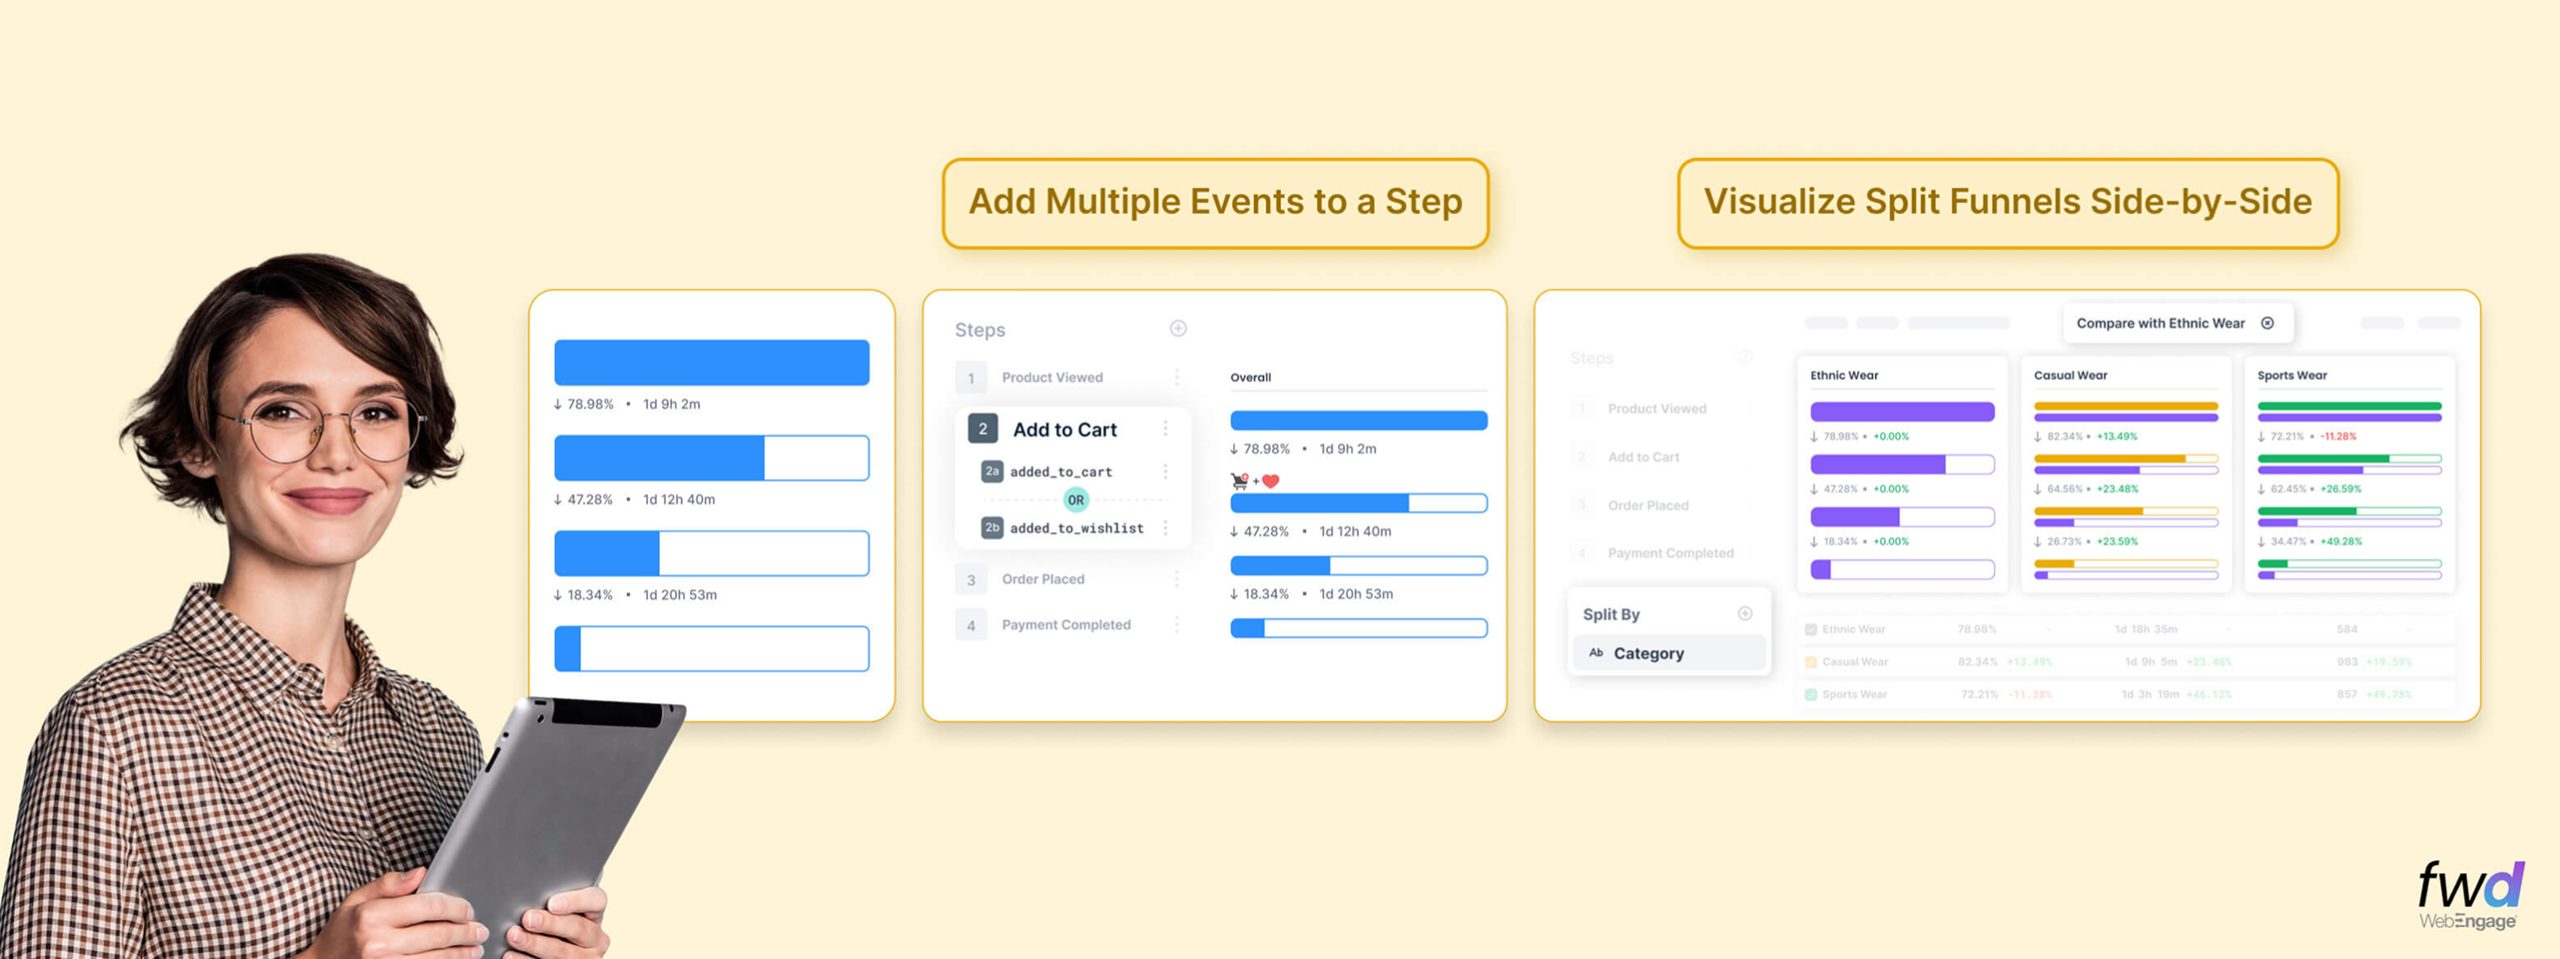
For a variety of reasons, this might be of use to you. E.g, if you are analysing any funnel to gauge “intent” at a certain step, you might want to add multiple events to the step that helps define intent. In the example below, added_to_cart and added_to_wishilist events are added to a single step in the Funnel.
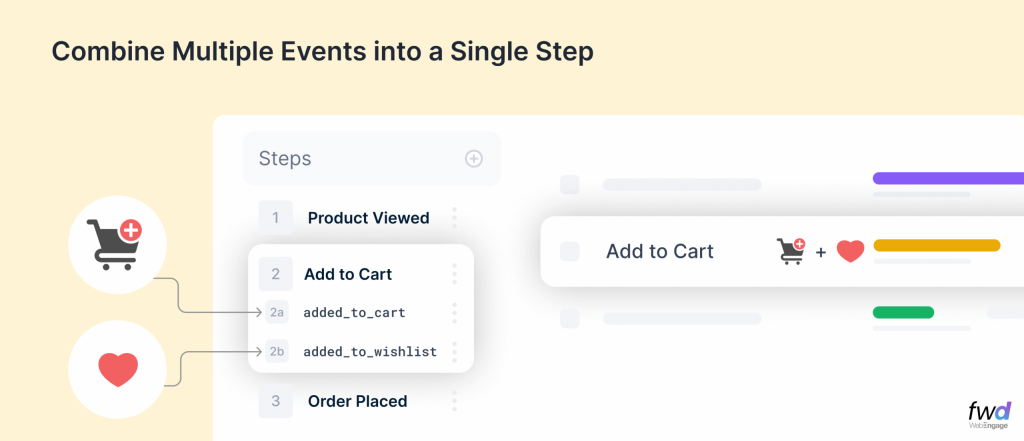
Of course, you can use this in cases when your events follow a different nomenclature based on where they are coming from (app/web/API etc). You could aggregate all those in a single step of the funnel to measure meaningfully.
Split Funnels by User Attributes, Event Attributes & Segments
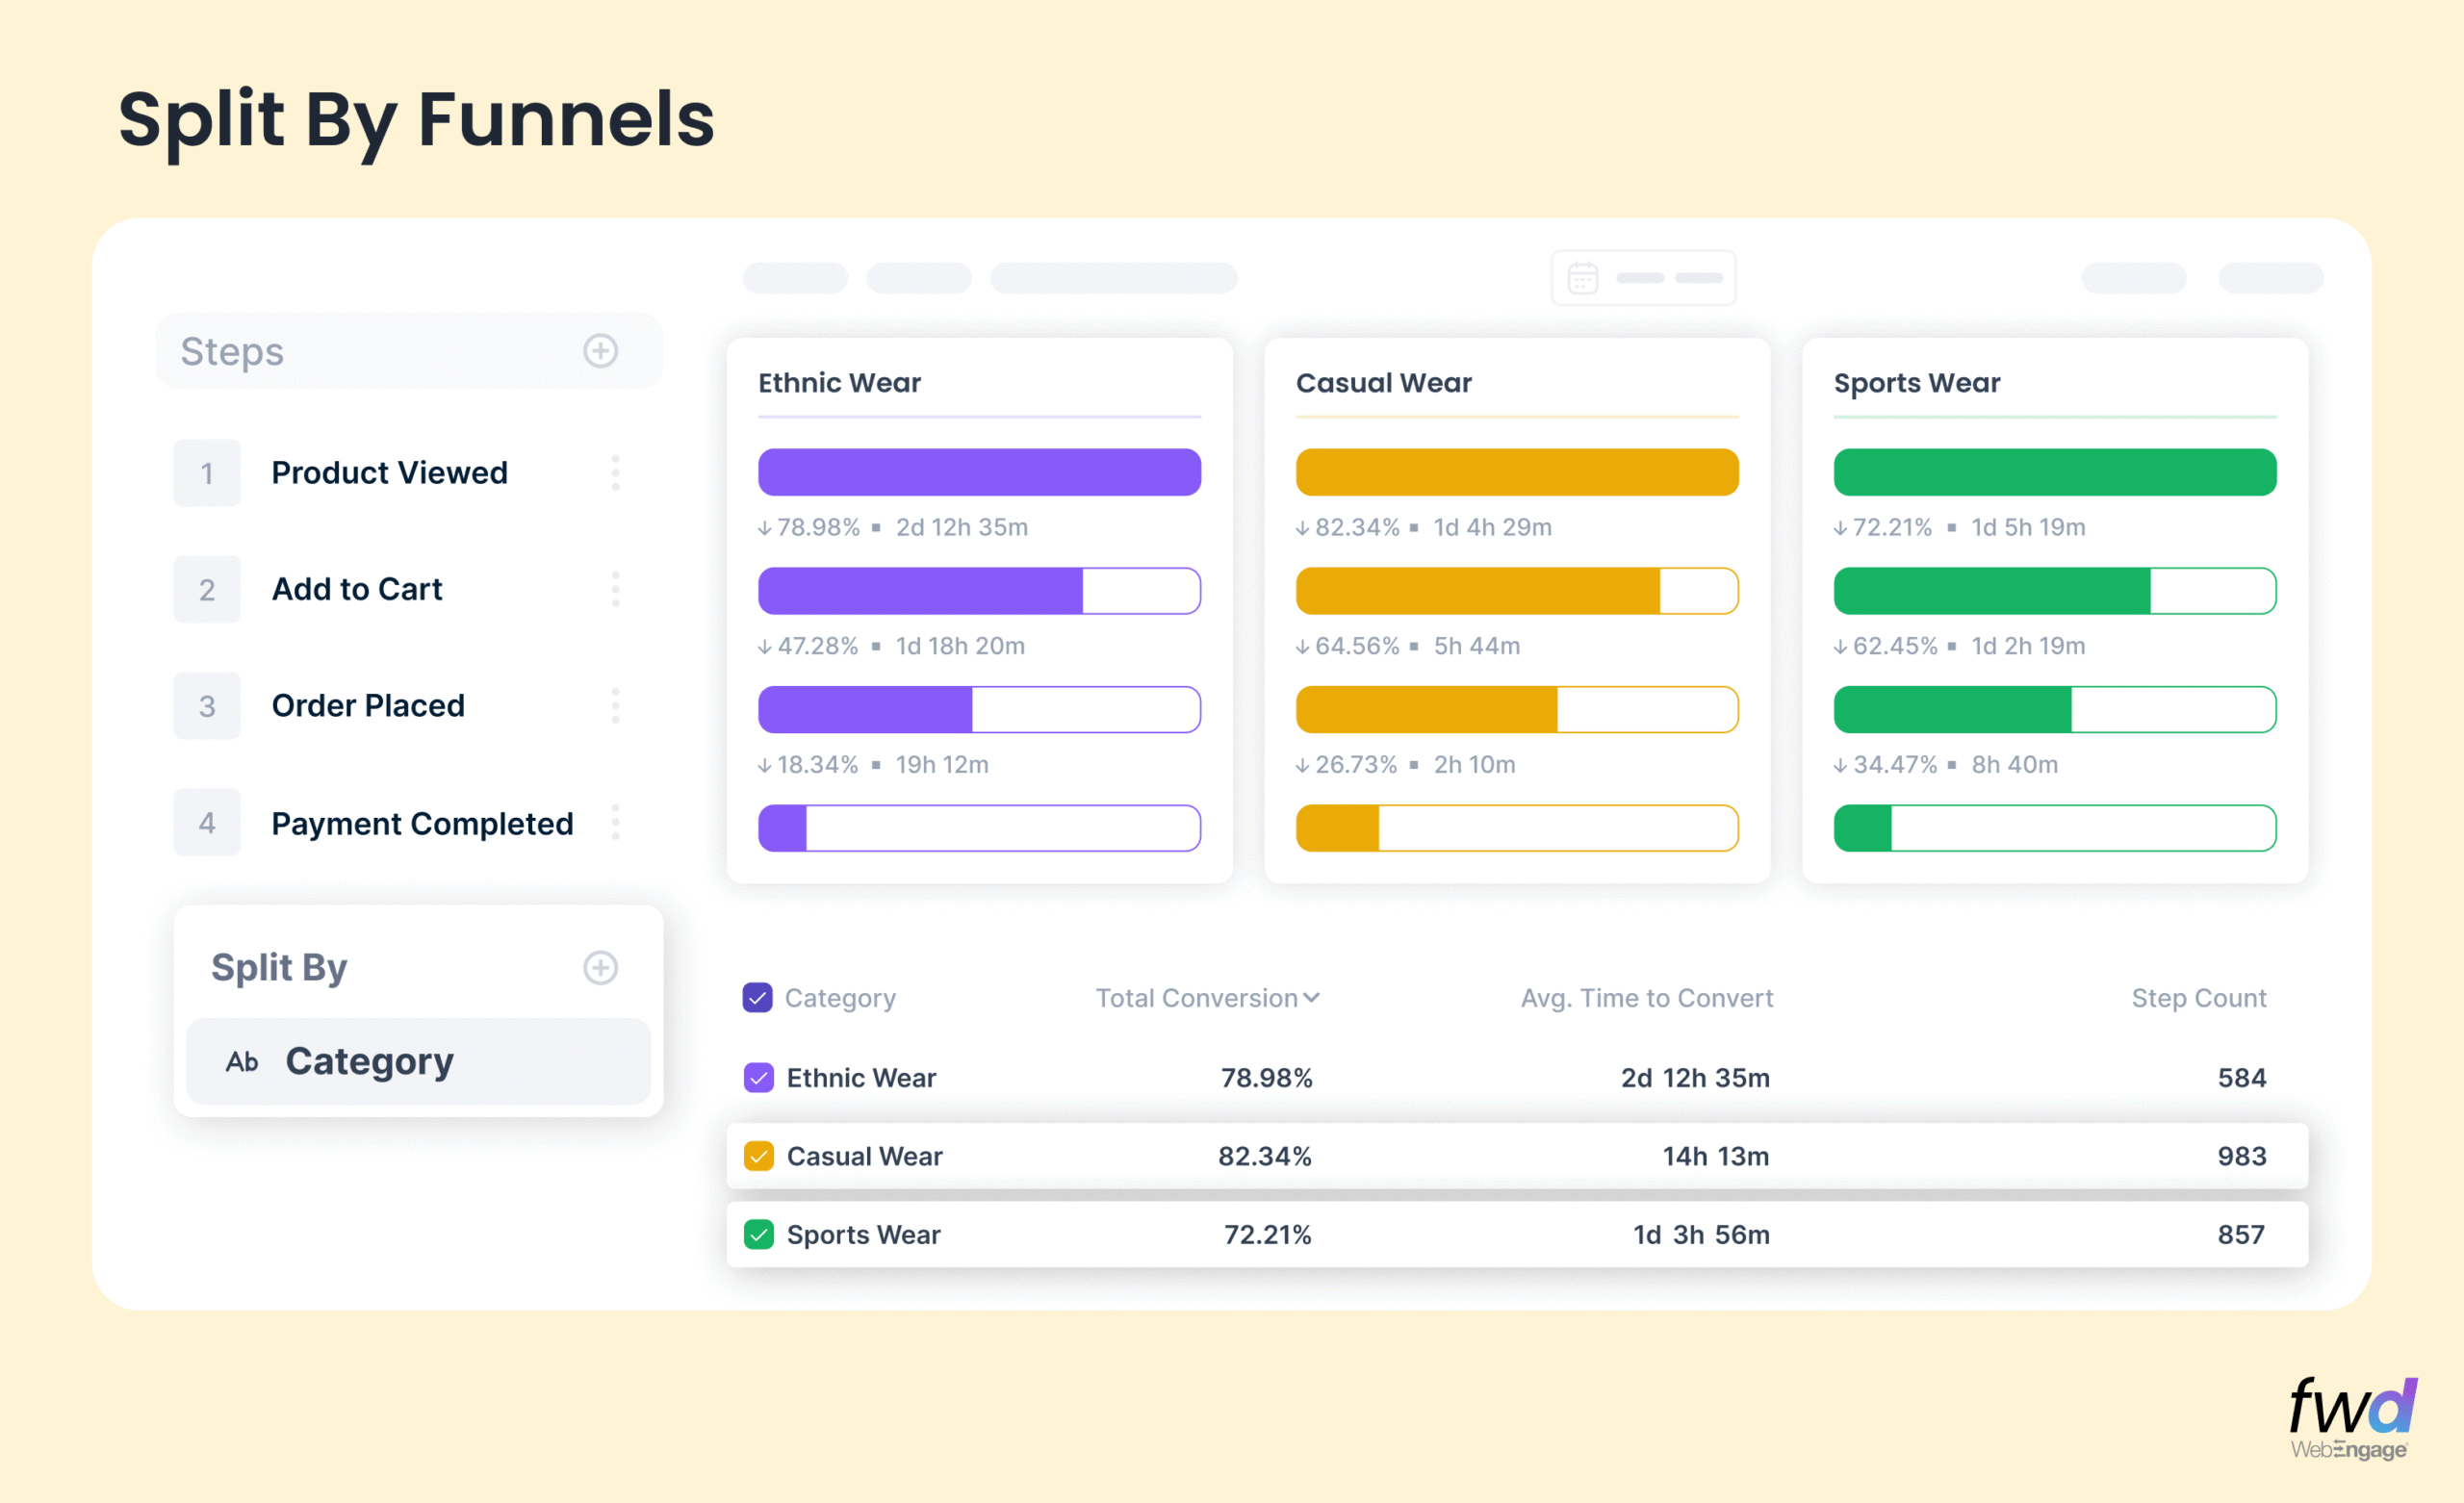
Choose any attribute in the event used in your Funnel to create a split view as shown below. You can also use user attributes or your segments to compare. Did you notice how you could see these splits in a single view without having to create multiple Funnels for the same? The top pane scrolls horizontally if you have more dimensions for the split.
Compare Funnels with an anchor Dimension
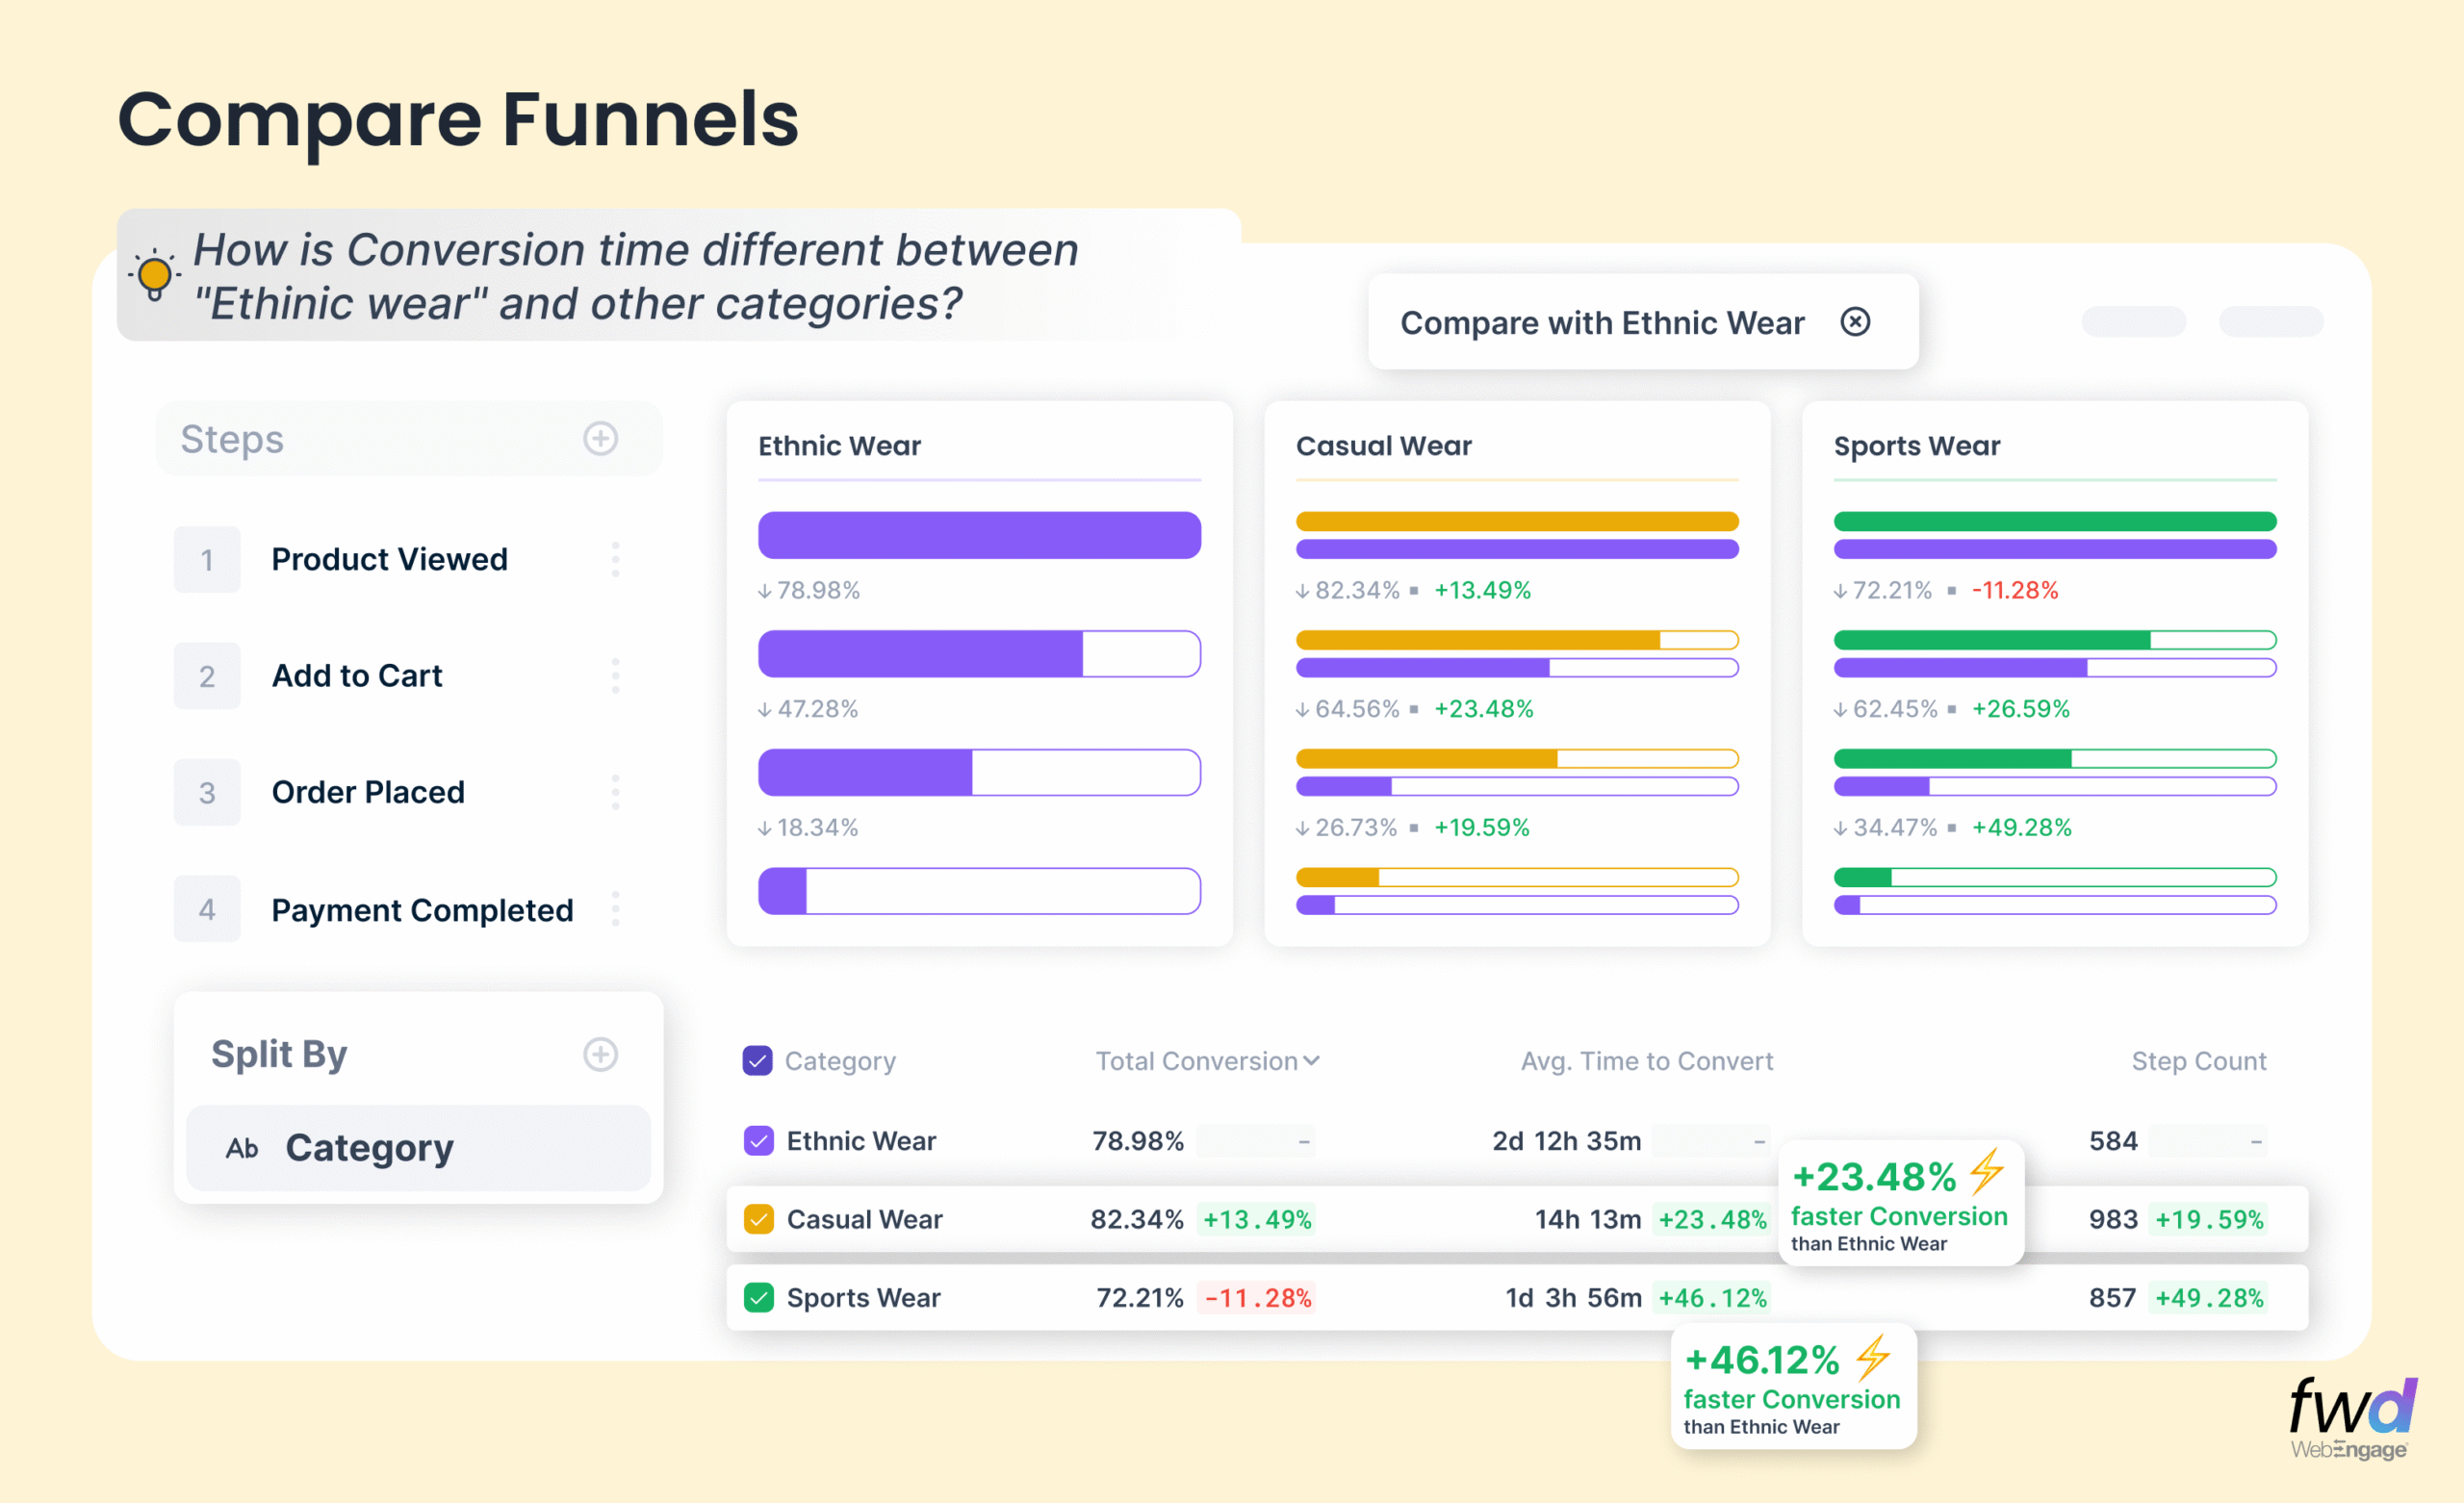
What’s the average time to convert for first time buyers versus repeat purchasers? (segment comparison)
How do the conversion rates compare for two product categories? Say, Electronics vs Fashion? (event attribute comparison)
How does the drop-off at each step of the Funnel compare for the example above?
Do you use all kinds of analytics dashboards searching for answers to those questions above? Look no further. WebEngage Funnels have all these answers you seek!
Percentile distribution of Conversion Times
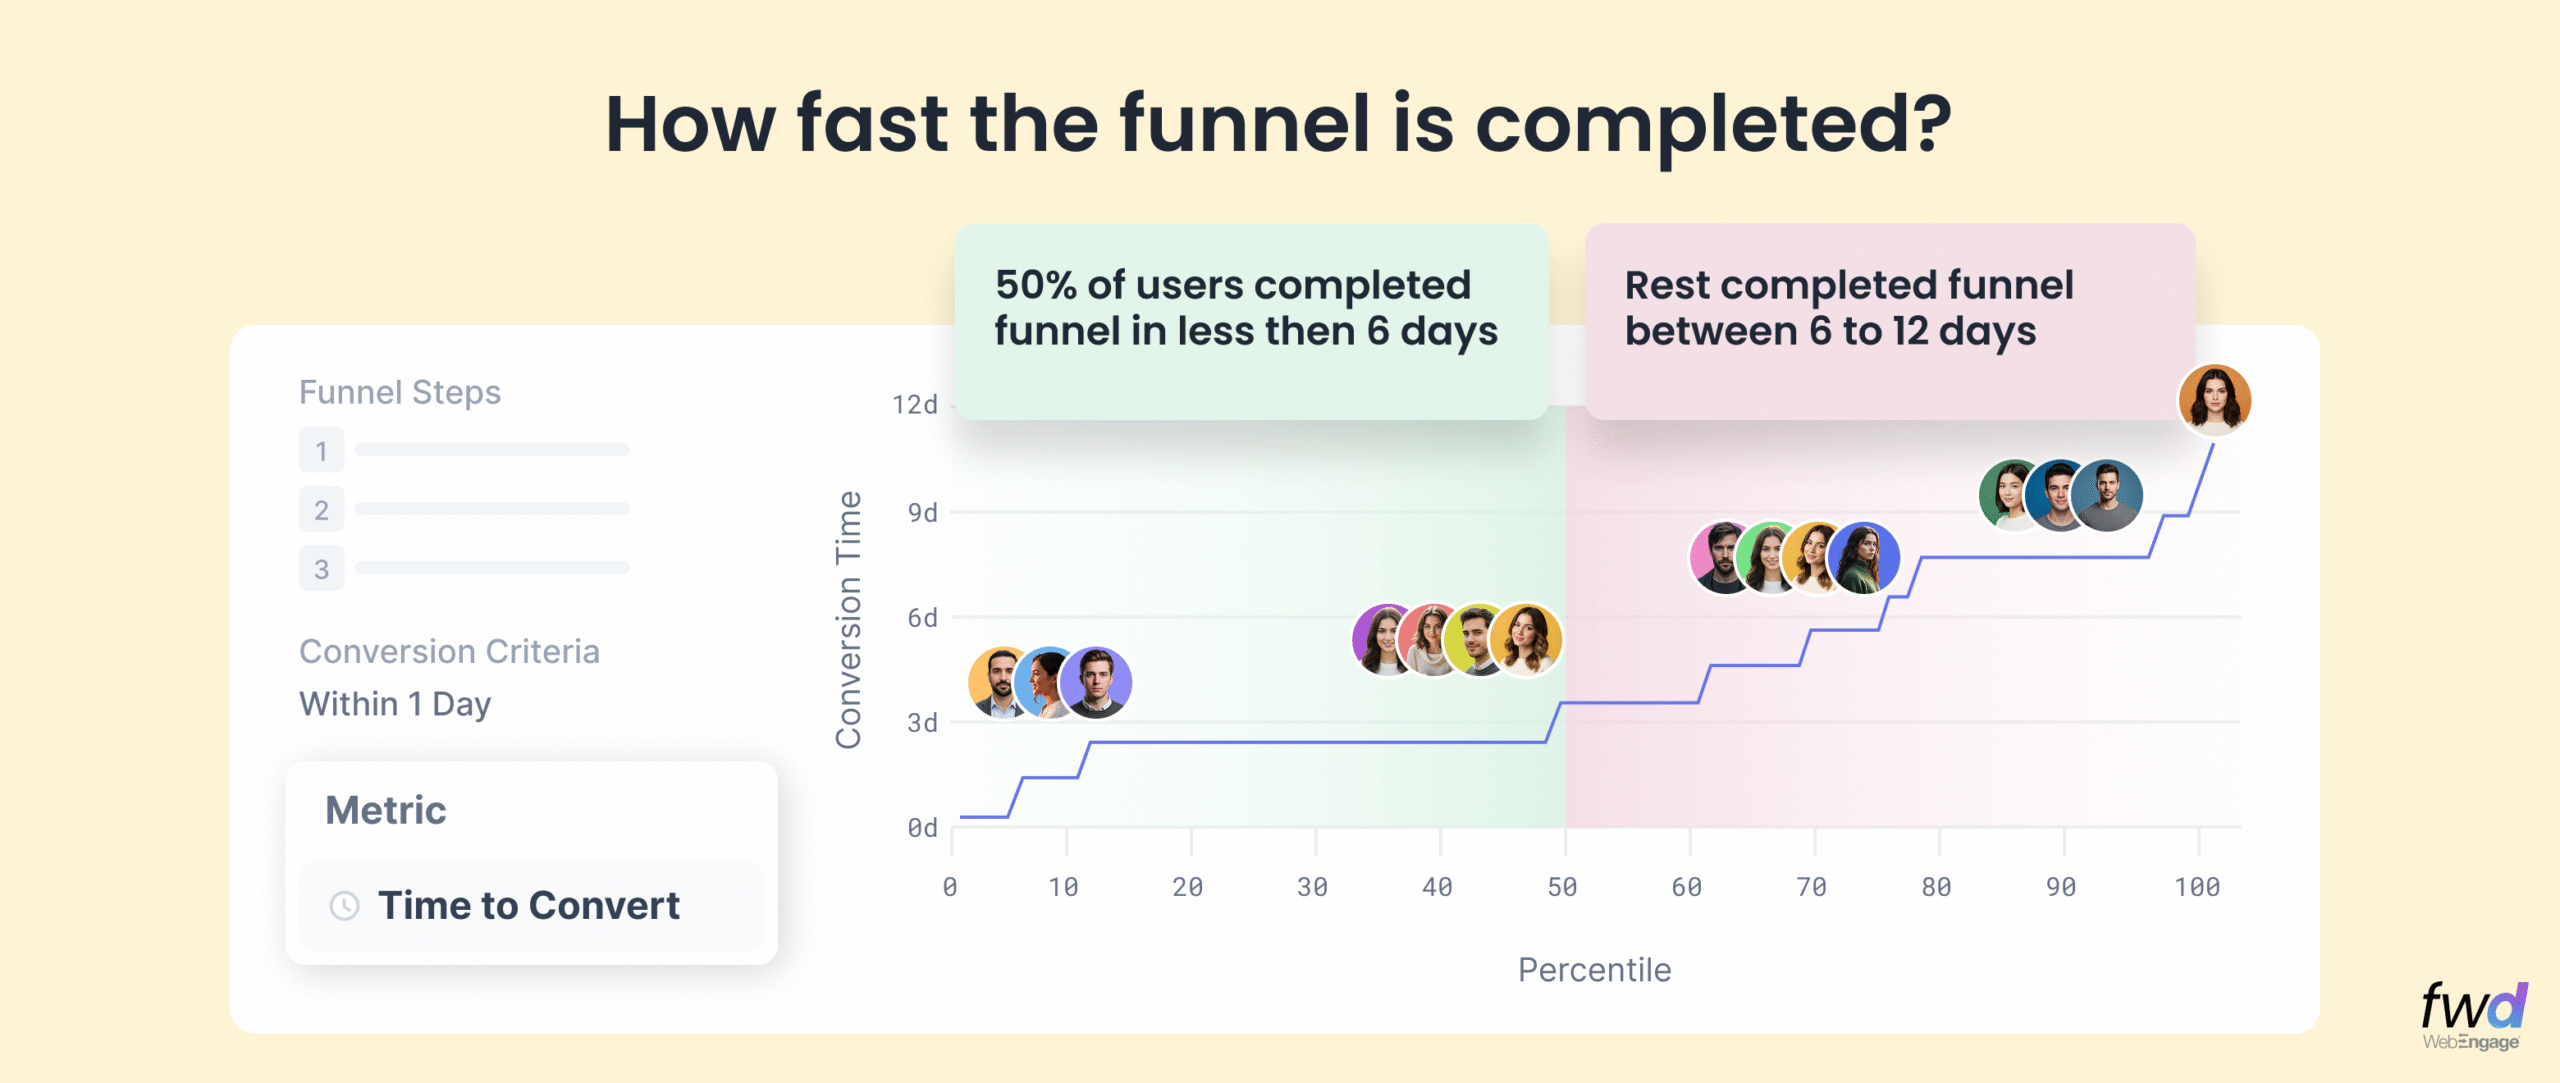
Not all users convert at the same speed. Averages often hide crucial signals. With percentile conversion analysis, you can now identify…
- How soon the fastest 10% of your users convert?
- How much time the slowest 20% of your users take to convert?
- What’s the median conversion time?
Our customers often use Funnel metrics and key insights shared above to generate high quality Customer Journeys with intelligent nodes and paths. We recently launched the ability to modify active Journeys using our Live Editing feature thereby making experimentation and adjustments in User Journeys based on Funnel insights even more real-time!
Check out our how Live Journey Edits work →
I recommend this for your leisure reading – A comprehensive guide on WebEngage Funnels
The revamped Funnel interface is rolled out for most of our customers. If you still see the older version, please make a request to switch to the new avatar from within your dashboard. Happy analysing 🙂