


As a media & entertainment brand, your mobile app generates a wealth of data every day, and each piece of information holds the potential to provide valuable insights that can enhance your customer engagement and retention.
But which mobile app metrics should you focus on?
In the rapidly evolving world of Media & Entertainment, where app downloads have exceeded a staggering 2.2 billion and global consumer spending has surpassed $6.3 billion, it’s easy to feel overwhelmed, like a pilot navigating through a storm without navigation coordinates.
In this blog post, we will introduce you to the 10 essential mobile app metrics that are crucial for media and entertainment brands. By tracking these metrics, you will gain a deeper understanding of your users’ behavior, anticipate trends, and ultimately enhance your user engagement and retention.
10 Mobile App Metrics A Media & Entertainment Brand Must Track
A report from data.ai stated that the entertainment and book app genres made up nearly 50% of consumer spending worldwide in 2021 (illustrated in the chart below). This highlights the tremendous growth potential and opportunities within your industry.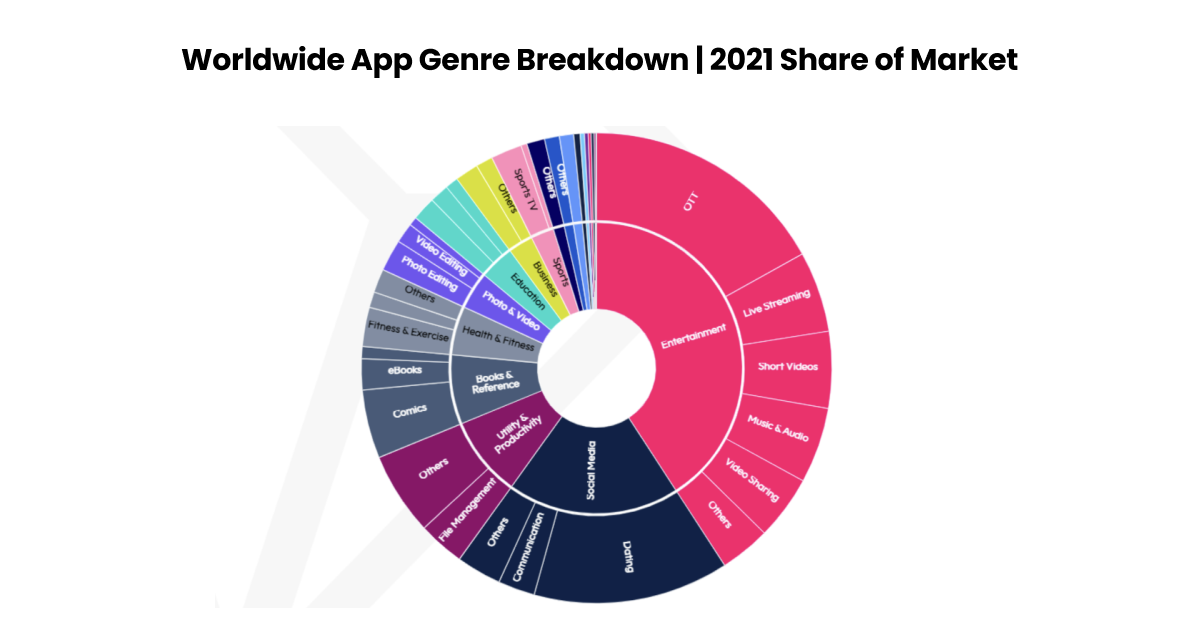
However, to achieve success, it’s essential to track the right metrics that provide insights into your audience and guide your decision-making process. With numerous mobile app metrics available, finding the ones that truly impact user engagement and retention may feel like searching for a needle in a haystack. So, which mobile app metrics can make a genuine difference for your brand?
Dive in as we unveil the ‘Top 10 Mobile Apps Metrics’ every media & entertainment brand must track. Ready to discover these game-changing metrics? Let’s get started!
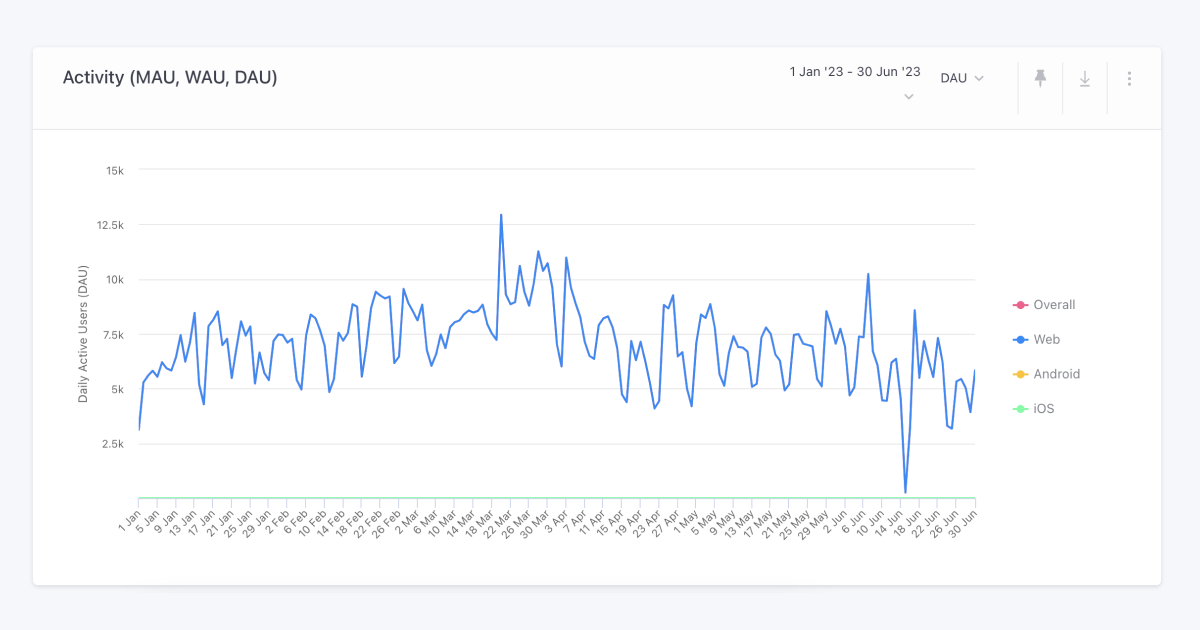
1. Monthly Active Users (MAU)
In the media and entertainment world, where content is consumed instantly and attention spans can be brief, keeping a close eye on your mobile app’s Monthly Active Users (MAU) is pivotal.
Defined as the number of unique users who engage with your app at least once within a month, this key performance indicator serves as a fundamental gauge of your app’s health and your brand’s reach.
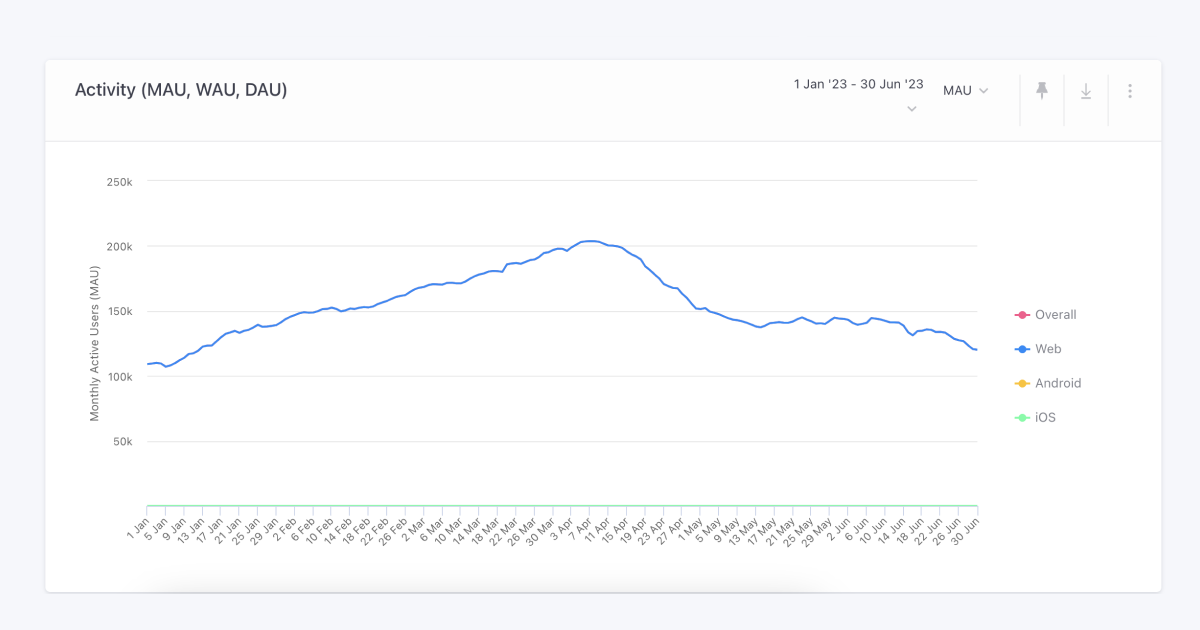
A robust MAU count signifies a thriving user base that regularly interacts with your app, indicating a successful user retention strategy. A decline, on the other hand, might signal a need for reassessment and strategy revamp.
One of the best ways to improve your app MAU is by providing personalized content. For example, an OTT could curate content recommendations based on each user’s viewing history. If a user frequently watches romantic comedies, the app could suggest similar titles, keeping the user engaged and returning for more.
Suppose you identify a decline in your app’s MAU count over the past few months. To counter this trend, you can implement personalization strategies such as ‘binge-watch’ weekend events featuring popular series and exclusive new releases. You can further leverage push notifications to inform your users about this event. This can increase the MAU for the month, with increased user engagement on the weekend.
Tools like WebEngage provide the means to create unique mobile app experiences and push notifications tailored to each user. Companies leveraging WebEngage’s app personalization have witnessed a remarkable 1.3X increase in Monthly Active Users (MAUs).
2. Average Session Length
The Average Session Length (ASL) is a key metric for media and entertainment brands, especially in an era where Over-The-Top (OTT) services have become a central part of consumers’ daily lives. ASL measures a user’s average time on your app during a single session. A Deloitte survey reveals the average session length of OTT users is 2 hours per day, with some users spending more than 3 hours. This rising engagement underlines the importance of monitoring and optimizing ASL for better user retention and loyalty.
An elevated ASL generally signifies that users are hooked on your content, finding it compelling enough to stick around. Tracking ASL provides valuable insights into user behavior. For instance, a consistent pattern of high ASL during specific times indicates peak viewing times. This data can help tailor your content release schedule, promotions, and events, boosting viewer engagement.
For example, you discover that your app users typically drop off midway during longer movies or series episodes, possibly due to lack of time or less attention span. Your app can start curating more short episode series that fit into the users’ quick breaks or commutes. This will encourage users to return to the app during their short breaks and boost engagement.
3. Content Visibility And Discoverability
A media and entertainment brand’s success hinges largely on its ability to ensure content visibility and discoverability amidst a sea of options available to users. In fact, a recent survey stated that 58% of respondents identified visibility and discoverability as significant challenges when launching and monetizing Free Ad-Supported TV (FAST) channels.
A key metric here is the “search visibility score.” This score gauges the frequency of your app’s or content’s appearance in search results when users input relevant keywords. This metric is calculated by monitoring the number of impressions (the frequency of your app is visible in searches) for specific keywords and dividing this by the total number of searches for those keywords.
For example, if your app appears 500 times in search results out of 1,000 total searches for a specific keyword, your search visibility score for that keyword would be 0.5 or 50%. A higher score suggests that your app is successfully breaking through the digital noise and reaching your target audience.
The “content discoverability” metric is equally critical and can be measured via the ‘click-through rate’ (CTR), which is the ratio of users who interact with your app’s content to the number of total users who view the app. Suppose your app is clicked 200 times out of the 500 times it appears in search results. In that case, your CTR is 40%. A higher CTR is indicative of higher engagement with your content.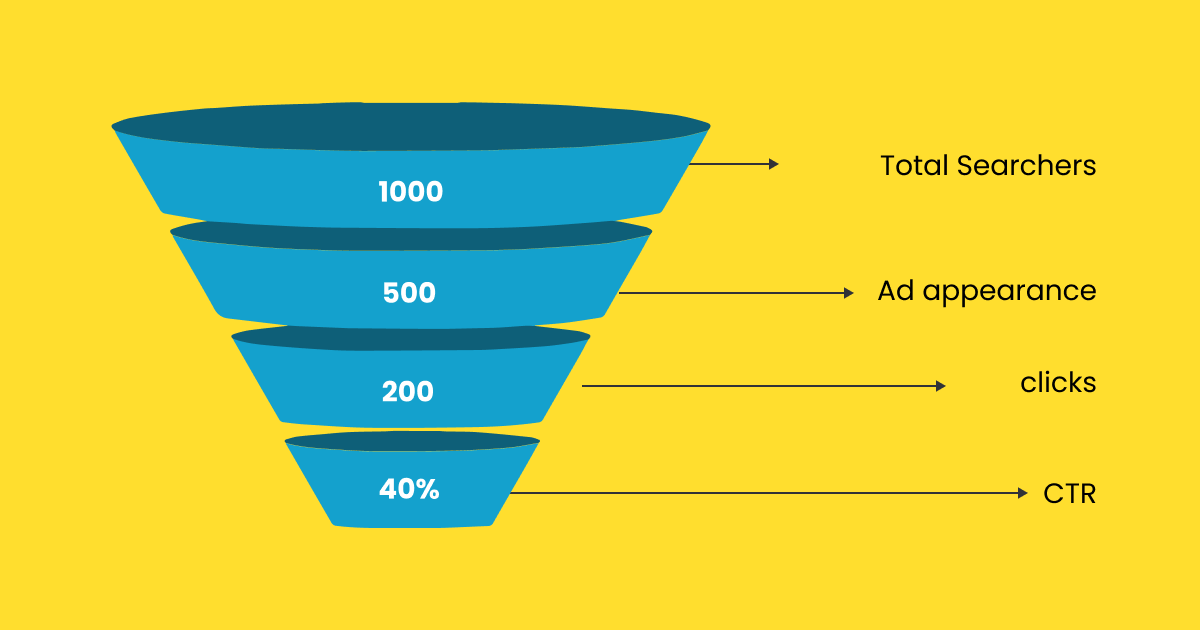
By tracking these mobile app metrics and optimizing your strategies for improved visibility and discoverability, your brand can ensure its content does not get overlooked. This will facilitate a direct link from the user’s search to your content, cultivating greater engagement and, consequently, leading to increased user retention.
For example, if your app notices a decline in user engagement despite having a diverse library and suspects it could be due to poor content visibility and discoverability.
To address this, you can implement robust SEO practices and use popular keywords related to your app’s content descriptions. This effort increases the app’s “search visibility score,” meaning it appears more frequently in search results when users look for particular content you offer.
4. Average Revenue Per Paying User (ARPPU)
One of the most vital mobile app metrics for media and entertainment brands is the Average Revenue per Paying User (ARPPU). It provides critical insights into the effectiveness of your platform’s monetization strategies and pricing models. ARPPU allows you to evaluate each paying user’s financial contribution to your platform, thus optimizing your revenue streams.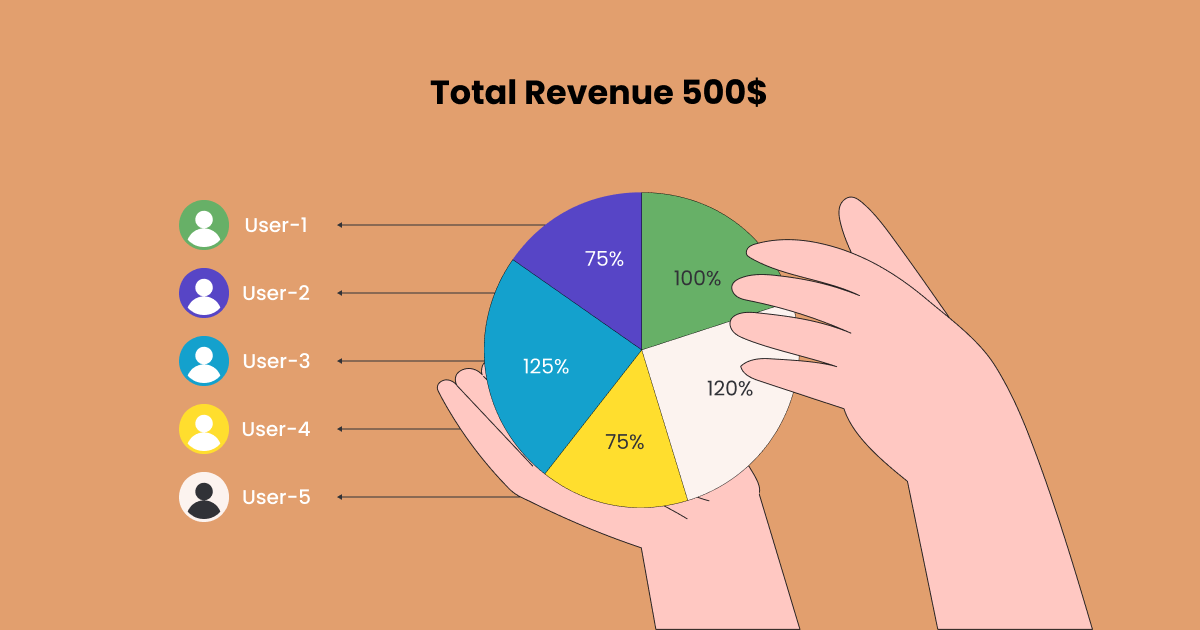
ARPPU values tend to be higher for OTT platforms compared to other subscription-based services. They typically range from $3 to $9 on average. However, for well-established platforms, this figure can climb to $15 or even higher per paying user. Factors such as user engagement, the effectiveness of pricing models, and the success of monetization strategies directly influence the ARPPU.
Let’s consider that your app operates on a freemium model, with both free and premium subscription options. However, despite an excellent user base, the app’s ARPPU stands low, indicating room for improvement. To boost your ARPPU and convert free users to premium ones, you could work on providing a more competitively priced annual subscription plan and offers for those who convert from free to premium subscriptions.
5. Churn Rate
The churn rate metric shows the percentage of users who discontinue service over a given period and offers key insights into user retention and satisfaction.
Several factors can impact the churn rate, including user engagement, streaming quality, device compatibility, and pricing structure. These factors collectively contribute to the user’s experience with your service, thereby influencing their decision to continue or discontinue their subscription.
Notably, even market leaders like Netflix are not immune to churn. Despite its position at the top, Netflix has experienced a rise in cancellation rates over the last two years, moving from 2.3% to 2.4%. These percentages may seem minor but can translate to substantial revenue loss given the platform’s enormous user base. Meanwhile, the average OTT churn rate fluctuated around 50% in the past year, underscoring the volatility and competitiveness of this sector.
Netflix and its competitor Disney+ present contrasting strategies for handling churn. Netflix leases over 700 titles, including numerous regional ones, offering users a wide variety of content. Meanwhile, Disney+ opts for periodic content releases, creating buzz and anticipation around shows like Mandalorian and Wanda Vision.
These approaches highlight the role of content strategy in user retention. High-impact titles can lead to what’s known as ‘affinity scoring,’ helping assess how well a product fits a customer’s needs. Understanding user affinity towards certain shows can inform promotional efforts and predict what users will watch next, enhancing user engagement and reducing the chance of churn.
6. User Acquisition
User Acquisition (UA) holds prime importance in the media and entertainment industry as it forms the foundation of growth strategy. However, it has evolved into a challenge of its own, particularly for streaming platforms. The surge in the number of streaming services, which currently sits at over 200 worldwide, has significantly intensified the competition for viewer acquisition.
As the streaming market keeps expanding, the ability to attract and retain users will dictate your app’s success. Hence, monitoring the UA metric — the measure of new users your app attracts within a specific time frame — has never been more critical.
Additionally, understanding the User Acquisition metric becomes essential for gauging the effectiveness of your marketing and advertising campaigns, identifying the channels that drive the most user growth, and making strategic decisions. Also, by comparing the user acquisition cost (CAC) with the lifetime value (LTV) of a customer, you can determine whether your acquisition strategies are sustainable.
Suppose you have a music streaming app. You notice that the users acquired through social media have a lower acquisition cost and higher lifetime value. These users also tend to interact more with the app, creating playlists, following other users, and sharing music.
With this data, you can make informed decisions to invest more heavily in your social media marketing efforts. You can also launch features that encourage the social sharing of music within the app, amplifying their organic reach and boosting user engagement.
7. Customer Lifetime Value (CLTV)
CLTV measures the total revenue your brand can reasonably expect from a single customer account throughout its relationship with your app. It considers factors like revenue per user, the average duration of a user’s subscription, and the cost of servicing the customer.
CLTV helps identify the most valuable customers, shape personalized marketing strategies, and inform resource allocation for acquisition versus retention efforts. Moreover, understanding your CLTV can aid in designing effective pricing strategies and predicting future revenue.
However, CLTV is not a static metric; it evolves with changes in user behavior, market conditions, and brand strategies. Therefore, it is crucial to recalculate and reassess it periodically. In the entertainment and media sector, enhancing user experience, improving content quality, and personalizing customer engagement can substantially increase CLTV, leading to improved business profitability in the long term.
Suppose your OTT app offers various subscription tiers, from a basic to a premium one. You find that your premium subscribers, although fewer in number, have a CLTV significantly higher than their basic subscribers due to the higher subscription rate and longer average subscription duration.
This insight can empower you to focus more on retaining these high-value premium subscribers. You can launch exclusive virtual events, early access to new releases, and personalized content recommendations for these premium subscribers, further enhancing their experience. You can also adjust your marketing strategies to target potential users more likely to subscribe to the premium tier.
8. Conversion Rate
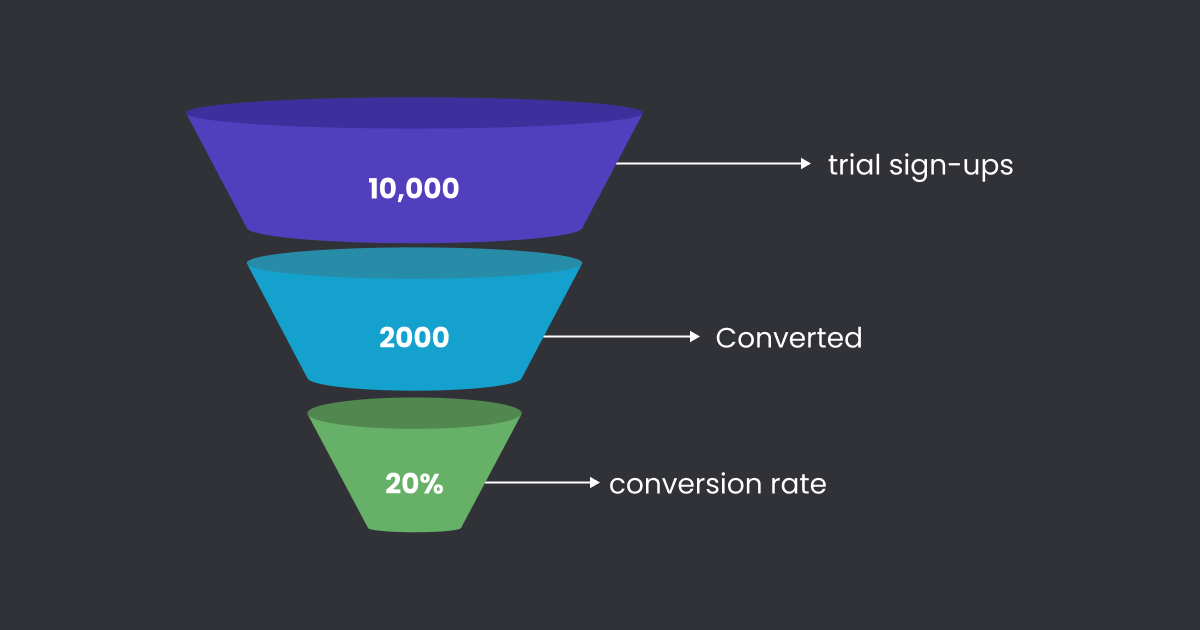
Conversion Rate is the percentage of users who complete a specific desired action, such as signing up for a trial, upgrading to a premium subscription, or making an in-app purchase. The conversion rate essentially gives you a clear indication of how effectively your app is persuading users to take these desired actions.
Suppose your app is offering a free 30-day trial to attract users. If 10,000 users signed up for the trial and 2,000 converted to a paid subscription, your conversion rate would be 20% (2,000/10,000 x 100%).
However, aiming for a high conversion rate is beneficial; striking a balance is also essential. Too much emphasis on conversion might lead to practices prioritizing short-term gains over long-term user satisfaction. Understanding your audience, offering value, and improving the overall user experience is key to maintaining a healthy conversion rate.
For example, your music streaming app offers a two-week free trial to new users and aims to convert these trial users into paid subscribers. However, you noticed that your conversion rate has been dipping over the last few quarters.
To reverse this trend, you could offer premium users exclusive early access to new releases to boost this rate. This exclusivity can entice free users to upgrade, knowing they’ll get early access to new music.
This strategy not only improves conversion rates but also enhances customer engagement and retention, as users are likely to stay subscribed to continue receiving these benefits.
9. Ad Engagement Rate
Ad Engagement Rate measures the level of interaction users have with your ads. It’s not just about viewing the ad; it’s about the actions taken upon seeing it. This could be anything from clicking on the ad to sharing it, commenting on it, or even making a purchase. A high ad engagement rate signifies that your ad content resonates with your audience, leading to increased brand awareness and potentially higher conversion rates.
Suppose your media app displays a specific ad to 10,000 users in a day. Out of these users, 500 interact with the ad by either clicking on it, sharing it, or commenting on it.
To calculate the Ad Engagement Rate, you would divide the number of engagements (500) by the total number of users who saw the ad (10,000). Multiply the result by 100 to get the percentage.
So, Ad Engagement Rate = (500 / 10,000) * 100 = 5%
This means that 5% of the users who saw the ad interacted with it in some way.
In the OTT platform landscape, the average Ad Engagement Rate hovers around 0.50%. While this figure might seem small, remember that in the digital space, even fractions of a percentage can translate to significant numbers, given the vast user base.
Let’s take an example of a live sports streaming app. Suppose your live sports streaming app with in-app advertisements noticed a drop in the ad engagement rate.
To boost this rate, you could introduce interactive ads related to the ongoing sports event. For instance, during a live football match, users could be shown ads that allow them to predict the next goal scorer or the final score. Engaging with the ad could offer users a chance to win exclusive merchandise or discount codes.
This strategy not only encourages users to interact with ads but also enhances their viewing experience by adding an interactive element to the live game. As a result, users are more likely to engage with ads, boosting the Ad Engagement Rate.
10. Net Promoter Score (NPS)
Understanding your audience’s loyalty and satisfaction is crucial for an app’s success. This is where the Net Promoter Score (NPS) comes into play. NPS is a powerful metric that provides insights into your users’ loyalty and their willingness to recommend your app to others.
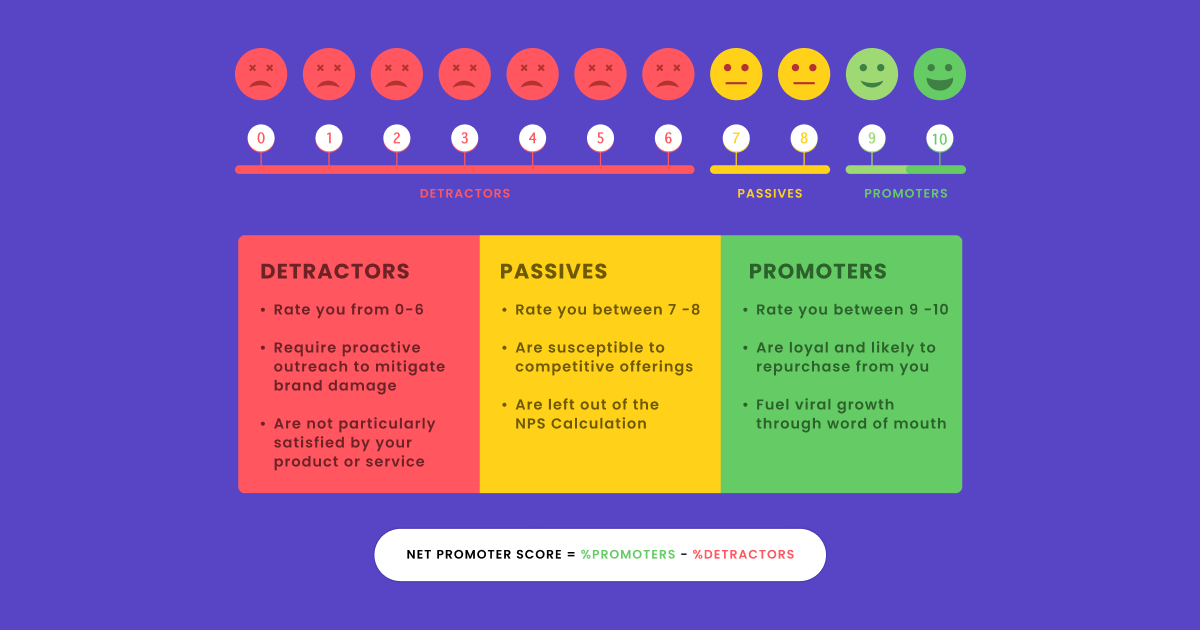
The score is derived from the answer to one question: “On a scale of 0-10, how likely are you to recommend our app to a friend or colleague?”
Based on their responses, customers are categorized into three groups:
- Promoters (9-10): These are your most loyal users who are likely to recommend your app to others and continue using it themselves. They are your brand advocates and are crucial for your app’s organic growth.
- Passives (7-8): These users are satisfied with your app but not enthusiastic enough to promote it. They might switch to a competitor if they find a better offering.
- Detractors (0-6): These are unhappy users who are unlikely to recommend your app and might even discourage others from using it. They could potentially harm your brand’s reputation through negative word-of-mouth.
NPS is a vital metric that directly correlates with user retention and growth. A high NPS indicates that users are enjoying your app and are likely to recommend it to others, leading to organic growth. On the other hand, a low NPS can signal potential issues with user experience, content, or functionality that need to be addressed.
By regularly tracking NPS, you can identify trends, understand the impact of any changes or updates made to the app, and take proactive measures to improve user satisfaction and loyalty.
Take a look at the infographic below to see how tracking these mobile app metrics can have a positive influence on your customer engagement and retention.
10 Mobile App Metrics for Media Brands: Boosting Engagement & Retention
1. MAU (Monthly Active Users):
Impact on Engagement: Assess the success of promotional campaigns and tailor content for higher engagement. Assess the success of promotional campaigns and tailor content for higher engagement.
Impact on Retention: Detect declines in user activity early to address issues and enhance content for better retention.
2. Average Session Length:
Impact on Engagement: Identify popular content genres, optimizing user experiences for higher interaction.
Impact on Retention: Longer sessions reflect user satisfaction, contributing to increased viewer retention.
3. User Acquisition:
Impact on Engagement: Measure campaign impact on content engagement, refining strategies for entertainment value.
Impact on Retention: Identify channels that attract long-term fans, enhancing overall viewer retention.
4. Content Visibility and Discoverability:
Impact on Engagement: Tailor content discovery to user preferences, enhancing engagement with preferred genres.
Impact on Retention: Ensure users discover appealing content, promoting loyalty and repeat viewership.
5. ARPPU (Average Revenue Per Paying User):
Impact on Engagement: Higher ARPPU suggests valuable content, influencing viewer engagement.
Impact on Retention: Analyze monetization strategies for better viewer retention without compromising quality.
6. Churn Rate:
Impact on Engagement: Identify aspects causing disengagement and address content-related issues.
Impact on Retention: Minimize churn rate for sustained viewer retention by delivering consistently engaging content.
7. CLTV (Customer Lifetime Value):
Impact on Engagement: Higher CLTV indicates ongoing engagement with appealing entertainment offerings.
Impact on Retention: Improve viewer retention through personalized content recommendations and experiences.
8. Conversion Rate:
Impact on Engagement: Optimize content presentation to captivate viewers, enhancing their overall experience.
Impact on Retention: Tailor offerings based on conversion insights for improved viewer retention.
9. Ad Engagement Rate:
Impact on Engagement: Refine ad content for resonating with the audience, boosting overall engagement.
Impact on Retention: Maintain viewer interest by addressing engagement drops signaled by ad metrics.
10. NPS (Net Promoter Score):
Impact on Engagement: Identify entertainment enthusiasts who promote the brand, fostering community growth.
Impact on Retention: Convert less satisfied viewers into loyal fans, aligning content with their expectations for better retention.
Conclusion
We’ve delved into the importance and insights of 10 critical mobile app metrics. These metrics offer a bird’s eye view of your app’s performance and can guide you in creating more personalized and engaging user experiences.
Understanding your app’s metrics is the first step, but implementing those insights requires robust and intuitive tools. That’s where WebEngage comes in. With WebEngage, you can create mobile app experiences unique to each user and deliver a personalized experience across your mobile app. It helps you leverage behavioral data and targeted segmentation to enhance user engagement and retention.


 Abdelrahman Hosny
 Prakhya Nair
 Ananya Nigam
 Niket Raja