


Introduction
EdTech companies have been at the forefront of the digital revolution in education, providing innovative solutions to students and educators alike.
However, the industry faces new challenges as the world grapples with the pandemic.
The edtech industry has been experiencing tremendous growth over the past few years, but as we head further into 2023, we’re facing a new challenge – a recession.
But the edtech boom witnessed in the past few years may not be enough to withstand the economic downturns caused by a recession. Economic instability and job losses can reduce the disposable income on education, negatively impacting edtech companies’ revenue streams.
Therefore, it is more important than ever for edtech businesses to develop a resilient and adaptable business model to fight the recession. One crucial aspect is tracking key metrics to maximize their resources and investments.
This blog will discuss the metrics and the importance of tracking them during a recession. We have highlighted 8 critical metrics your edtech businesses must track to navigate the upcoming economic downturn.
Discover how they can help you survive and thrive during the upcoming recession.
Metrics for Customer Acquisition
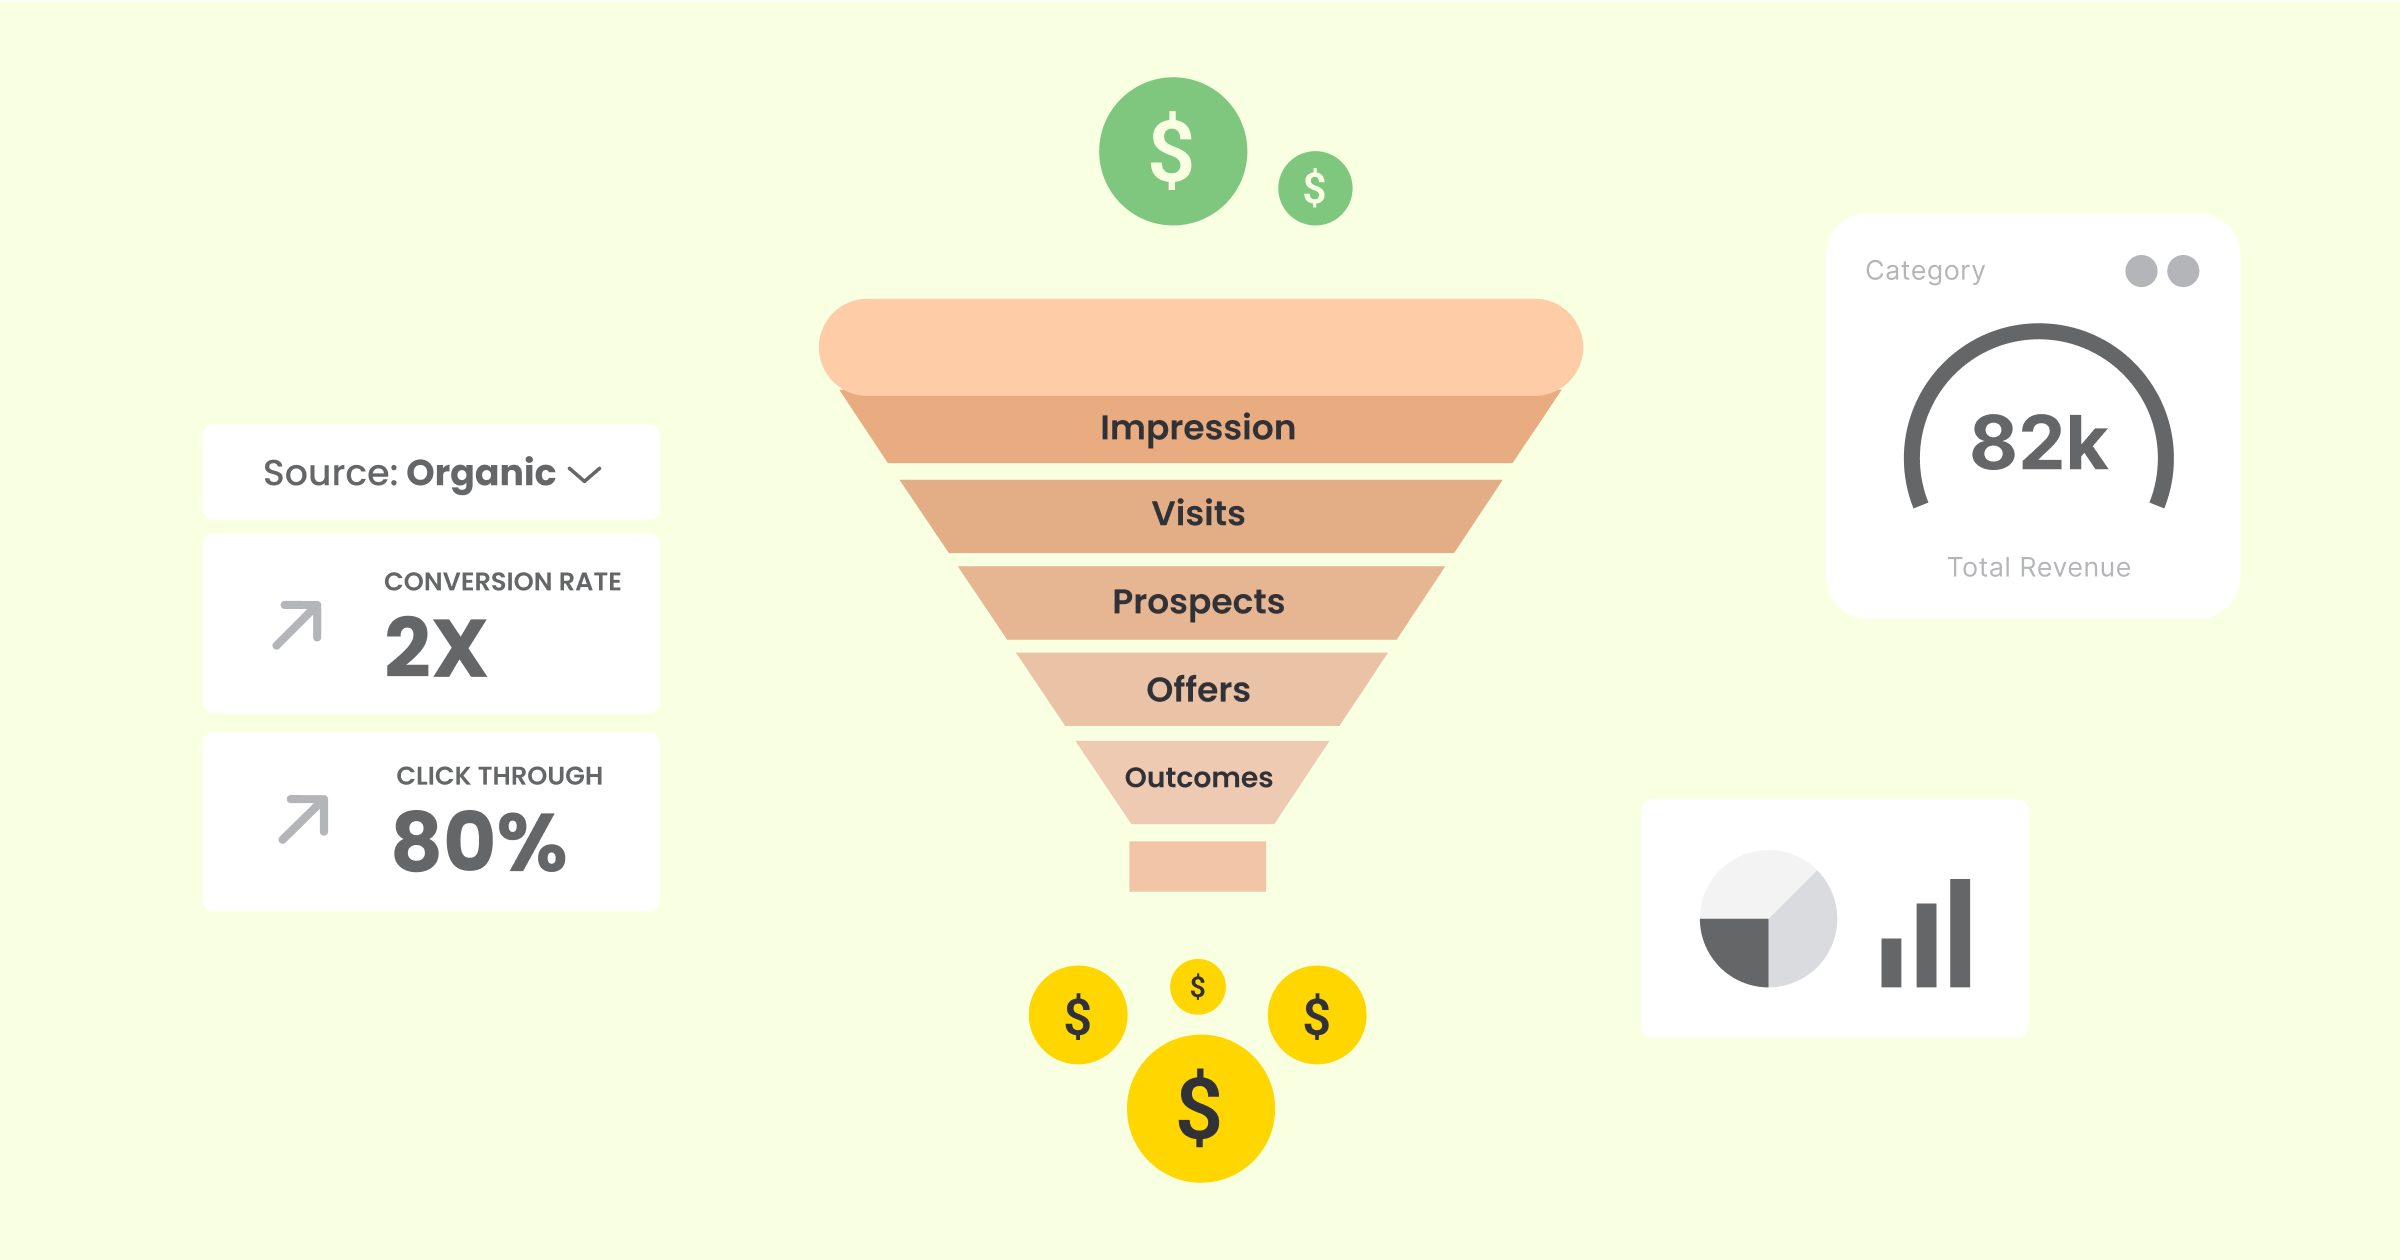
Metric #1: Cost per Acquisition (CPA)
We cannot stress enough how important CPA is for edtech companies to keep an eye on – it tells you how much startup budget you spend to get each new customer.
During a recession, when every penny counts, it’s even more critical to be smart about your resources.
By keeping your CPA low, you can ensure you are not overspending on acquiring new customers.
Let’s look at this example:
An edtech company spends $10,000 on a Facebook ad campaign that generates 100 new customers. The cost per acquisition, in this case, would be $100 ($10,000 divided by 100 customers).
Now that you know the CPA, you can ensure you are not overspending on getting new customers to your edtech business.
Tracking this metric over time helps you determine which advertising and marketing methods are the most effective in bringing in new customers. Moreover, this allows you to optimize your marketing strategies to ensure you reach potential customers most efficiently.
By keeping an eye on the CPA, you can be more strategic about your marketing spend and maximize your return on investment.
Metrics for Customer Retention

Metric #2: Churn Rate
edtech is a booming industry. However, with growth come challenges. According to Inside Higher Ed, the industry faces an overall churn rate of 13.2%. What does that mean?
When your user subscribes to an online course, your company wants to keep them as customers for as long as possible. Calculating the churn rate allows edtech businesses like yours to measure how many customers are leaving and why.
If many customers leave, it can be a big problem for you. Especially during tough economic times, losing that revenue can be costly.
By tracking the churn rate, you can figure out why customers are leaving and take steps to keep them around.
For example, suppose many customers cancel because they don’t find the material engaging or don’t feel like they’re making progress. In that case, you can improve the course content or offer more support.
You need to stay ahead of the curve and continually offer new and improved products and services to meet the ever-changing needs of students and educators.
Making these changes can keep more customers and the business running smoothly.
Metric #3: Customer Retention Rate
The Indian edtech market was worth $3.42 billion in 2021, and it’s predicted to grow at more than 30% each year from 2021 to 2026.
Let’s discuss something vital for businesses in this market – customer retention rate.
This is a way to measure how many customers keep using your edtech product after a certain time.
For instance, an edtech company has 1000 customers at the beginning of the month and loses 100 customers throughout the month. The customer retention rate for that month would be 90% (900 customers at the end of the month divided by 1000 customers at the beginning of the month).
It’s a super important metric for businesses to keep track of, especially during tough times like a recession. By monitoring the customer retention rate, you can determine where to improve your products or services to make your customers happy and loyal.
After all, having loyal customers is one of the keys to success in any business!
Download Ebook: How Leading EdTech Brands Are Acing User Engagement and Retention
Metrics for Revenue Generation
Metric #4: Monthly Recurring Revenue (MRR)
A metric that keeps their revenue stream healthy is monthly recurring revenue (MRR). This helps businesses track the predictable and recurring revenue generated from their customers’ subscriptions or services. By keeping an eye on MRR, you can better understand the health of your revenue stream and identify any potential dips in revenue before they become significant issues.
This can help you adjust your products or services and retain more customers in the long run.
Monitoring MRR is crucial for your edtech business to stay on top of your finances and continue to grow and innovate in the competitive market.
Metric #5: Average Revenue per User (ARPU)
The average revenue per user (ARPU) measures the average revenue generated per user. In 2023, it is estimated that the average revenue earned per user (ARPU) in the Indian edtech industry will be around US $35.99. Let’s say an edtech company offers students a subscription-based online learning platform. They have 1000 active users, and their monthly revenue is $10,000.
Using the ARPU formula, we can calculate that the average revenue per user is $10,000 / 1000 = $10.
This metric is critical for you to track during a recession because it allows you to optimize your pricing strategies to maximize revenue per user. By increasing ARPU, you can offset the potential decline in new customers during an economic downturn. Financial management software will help monitor metrics, spot issues early, and enhance financial performance in a competitive market.
Metrics for User Engagement and Conversion
Metric #6: User Engagement
In the world of edtech, there are some important metrics that companies need to keep an eye on to make sure they’re providing the best possible experience for their users. One of these metrics is user engagement.
User engagement is a way to measure how active users are on the edtech platform or product. This is important because when users are engaged, they’re more likely to stick around and keep using the product.
And, of course, that means more revenue for the edtech business!
In India, user engagement is significant because it’s a massive market for edtech products. In fact, according to a report by Statista, revenue in the edtech Industry is projected to reach US$5.76 Billion in 2023.
So, you must closely monitor user engagement to meet this growing market’s needs.
Metric #7: Conversion Rate
For edtech businesses, the conversion rate is an important metric to track as the industry is becoming increasingly competitive, and the conversion rate is 2-3%.
With so many players in the market, you must have a high conversion rate to stand out from the competition.
Edtech companies often rely on digital marketing to drive traffic to their websites and increase conversions.
This includes tactics such as search engine optimization (SEO), social media marketing, and email marketing.
You can identify the most effective marketing channels by tracking conversion rates and making data-driven decisions to optimize your marketing efforts.
In addition to marketing, conversion rates can reveal your company’s product or pricing issues.
For example, if you offer a free trial but only a few people are signing up, it could indicate that the trial period needs to be longer or that the service needs improvement.
By analyzing conversion rates, you can identify areas for improvement and make changes to their product or pricing strategy.
It helps you in making data-driven decisions.
It also hints at how you can optimize your website and marketing campaigns to attract more customers and increase conversions. Thus, it contributes to maximizing revenue for your edtech business.
Metric #8: Daily/Monthly Active Users Rate
The daily/monthly active users rate (DAU/MAU) measures the number of users who engage with their platform or application on a daily/monthly basis.
It is calculated by dividing the number of daily active users by the number of monthly active users, resulting in a percentage that reflects the engagement and retention levels among the user base.
A high DAU/MAU rate indicates that users find the platform valuable and engaging, which translates to higher user satisfaction and loyalty.
A low rate suggests that users may be experiencing difficulties or losing interest in the platform.
In this case, businesses need to investigate and address the root cause of the problem to improve the user experience and retain more users.
Tracking the DAU/MAU rate over time will enable you to identify patterns in user behavior, such as the most popular features, the time of day or week when users are most active, and the devices or locations from which users access the platform.
Armed with this information, you can make informed decisions about product updates, marketing campaigns, and user support to enhance the user experience and increase engagement.
Moreover, the DAU/MAU rate can help you forecast revenue and growth potential. As more users engage with the platform on a daily basis, the likelihood of monetization opportunities increases.
For instance, you can offer premium subscriptions, in-app purchases, or sponsorships to reach a broader user base and generate more revenue. So, the DAU/MAU rate is critical for edtech businesses to assess user engagement and retention levels, identify areas for improvement, and forecast revenue and growth potential.
By focusing on it, you can generate long-term value.
How are Indian EdTech giants dealing with the recession?
In the face of an uncertain economy and the ongoing pandemic, edtech giant BYJU’S is stepping up its game with innovative plans to survive and thrive in the education industry during the recession.
Here’s their game plan for 2023:
- BYJU’S has designed a path to profitability which they plan to achieve by March 2023.
- They are focusing on building brand awareness overseas through new partnerships.
- BYJU’S plans to hire 10,000 teachers to support their business in India and overseas.
- BYJU’S offers a range of courses catering to different age groups and competitive exams, making it less dependent on any market segment.
- BYJU’S has attracted high-profile investors such as the Chan Zuckerberg Initiative and the Qatar Investment Authority, which provides a financial cushion in a recession.
Final words

The economic recession in 2023 is expected to impact the edtech industry significantly. To survive in this challenging environment, you must prioritize tracking the above metrics that can help you make data-driven decisions.
You can identify improvement opportunities, improve your marketing and product strategies, and increase user engagement and retention. Ultimately, these efforts can help your edtech businesses weather the recession and emerge stronger on the other side.
You can also benefit from a shift in the perception of education, viewed as a lifelong journey rather than just a one-time event. This can lead to a more sustainable business model that is not just dependent on traditional academic cycles.
Gear up and get ready to weather the storm!


 Harshita Lal
 Prakhya Nair


 Niket Raja
 Amit Shinde