We have launched two new reporting features in Journeys today: (1) Detailed reports of an individual journey, and (2) Channel usage comparison of all your journeys.
Detailed Reports of Each Journey
In addition to the existing Live View of a journey where you see the Entry, Exit metrics and the various metrics for each of the blocks, you will now be able to see a summary of all the important metrics of a journey in one place.
With this change, each of your journey reports is now divided into two sections:
- The Overview section shows you a summary of the important metrics including detailed metrics for each of the campaigns in the journey, channel wise comparison of the various channels you’ve used for campaigns in the journey etc.
- The Live View section shows you the regular live statistics of users entering/exiting each of the blocks
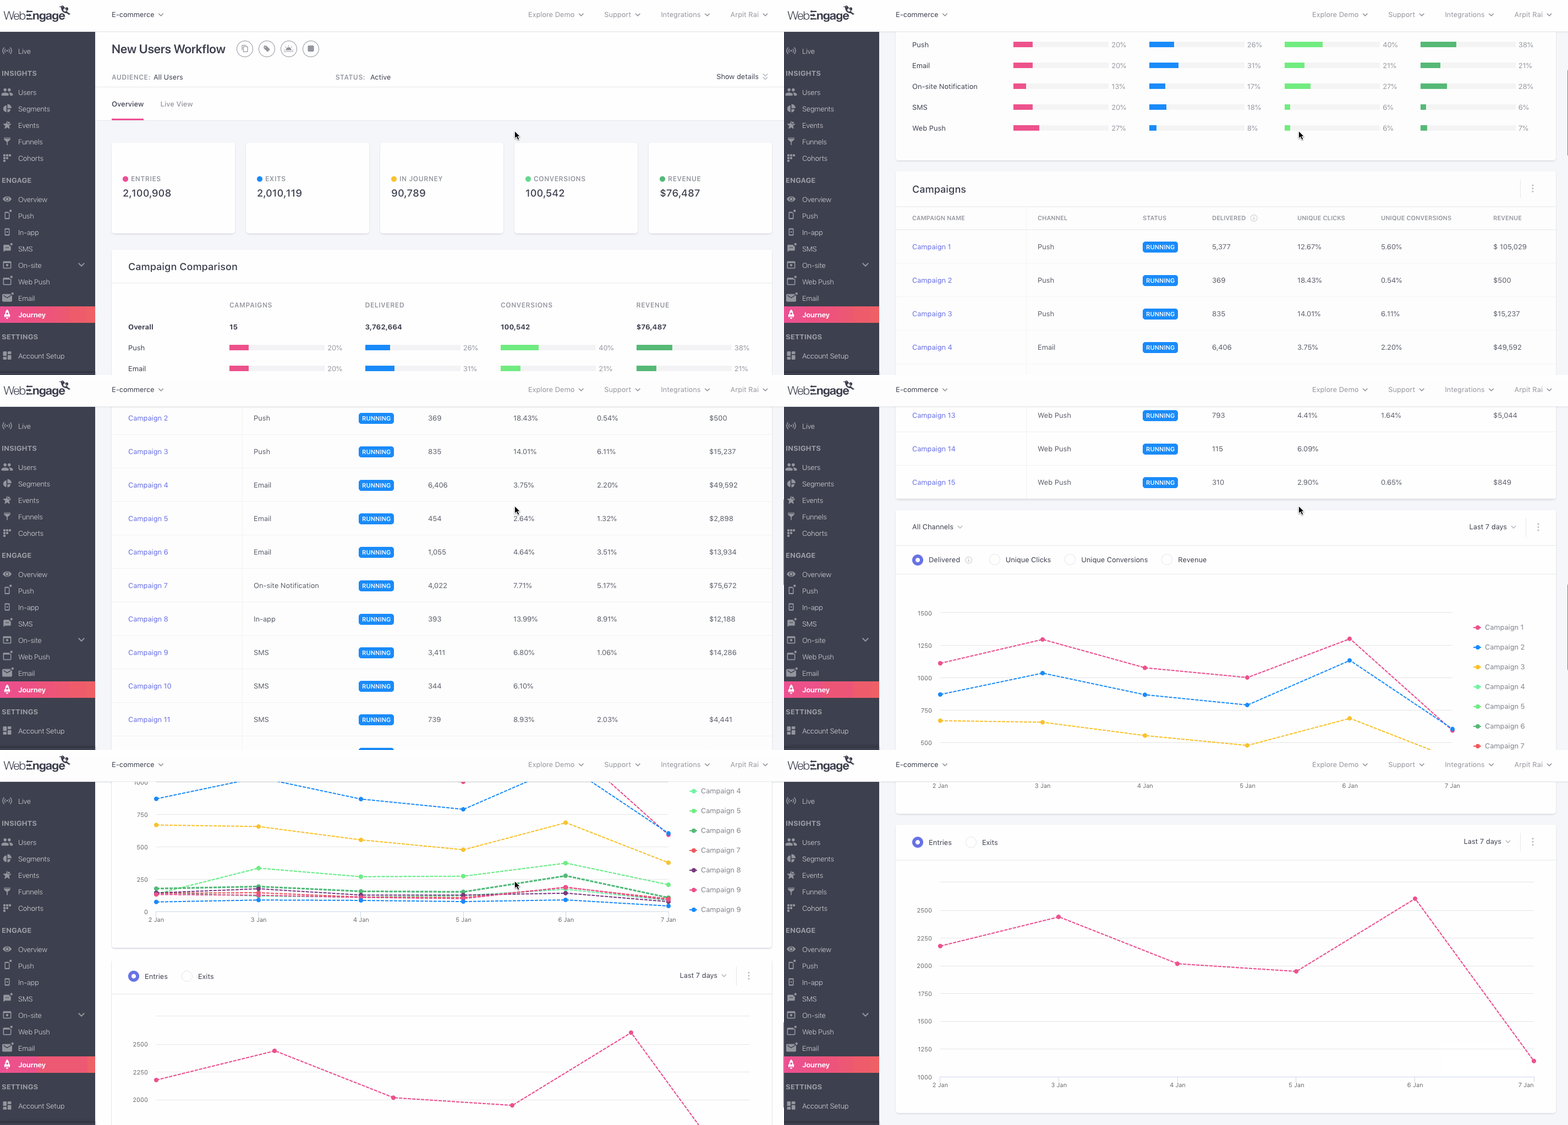
We made this change to make it easy for you to consume journey reports and make decisions even faster. You can now easily see which campaigns in the journey are performing well and which are not. You can now also see the various channels you’ve used for each customer journey and how each of these channels have contributed towards conversions and revenues. If you see that a particular channel or a particular campaign is not effective, you could quickly make the changes in the campaign to further optimize your journey.
You can now also see the various trends in the journey such as trends of users entering and exiting the journey over time, the trends of each of the campaigns in the journey and how they have contributed towards conversions and revenue over time.
This then brings me to the second feature we have launched in journeys today.
Channel Usage Comparison of All Your Journeys
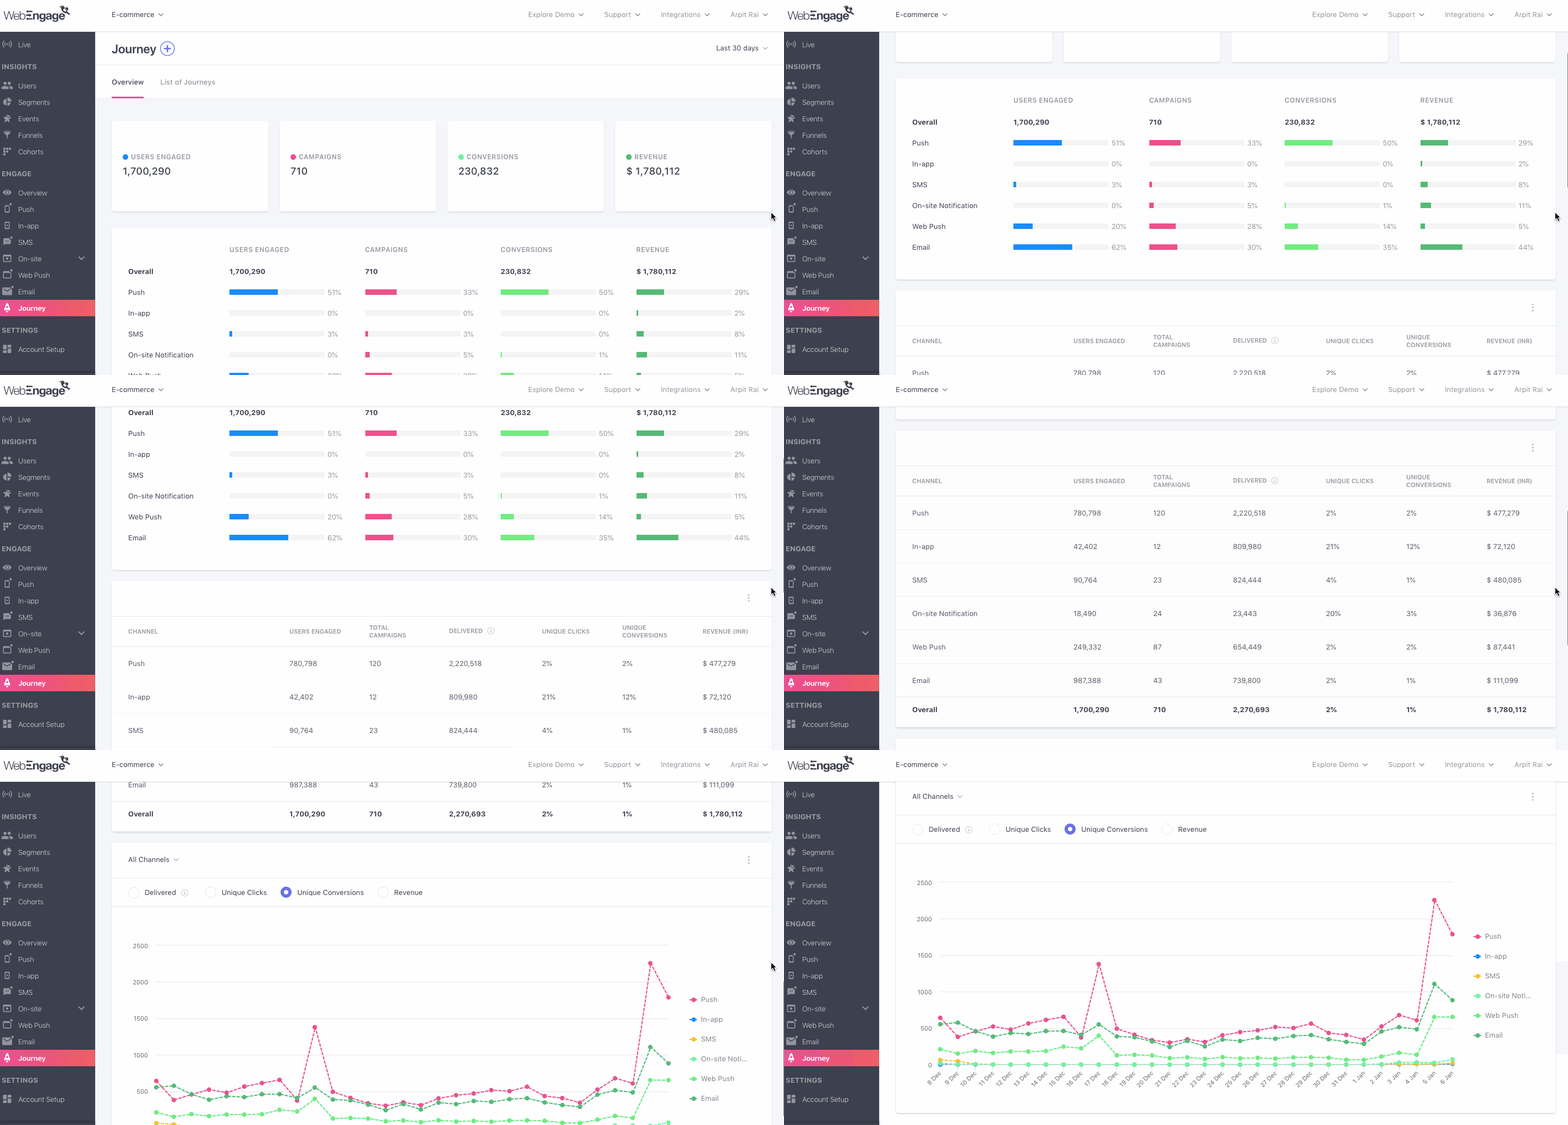
You will now be able to compare your usage of all the channels of user engagement across all journeys. You can now see which channel is contributing the most towards conversions or revenues across all journeys. You can now also see whether there are channels that you are not utilizing as much as the other channels. You will also be able to draw campaign insights such as My usage of Mobile Push as a channel of engagement is a lot more compared to other channels. However, Emails still contribute the most towards conversions and revenue even though I don’t use Email as a channel to engage users as much as I use Mobile Push.
As you can see in the screenshot below, you will be able to get a snapshot of this information at a particular point in time as well as observe the changing trends over time.
Try out our new feature and tell us what you think of it! Or request a demo from our Success team to learn more about this feature.





 Vanhishikha Bhargava
 Amit Shinde
 Harshita Lal
 Surya Panicker

 Dev Iyer