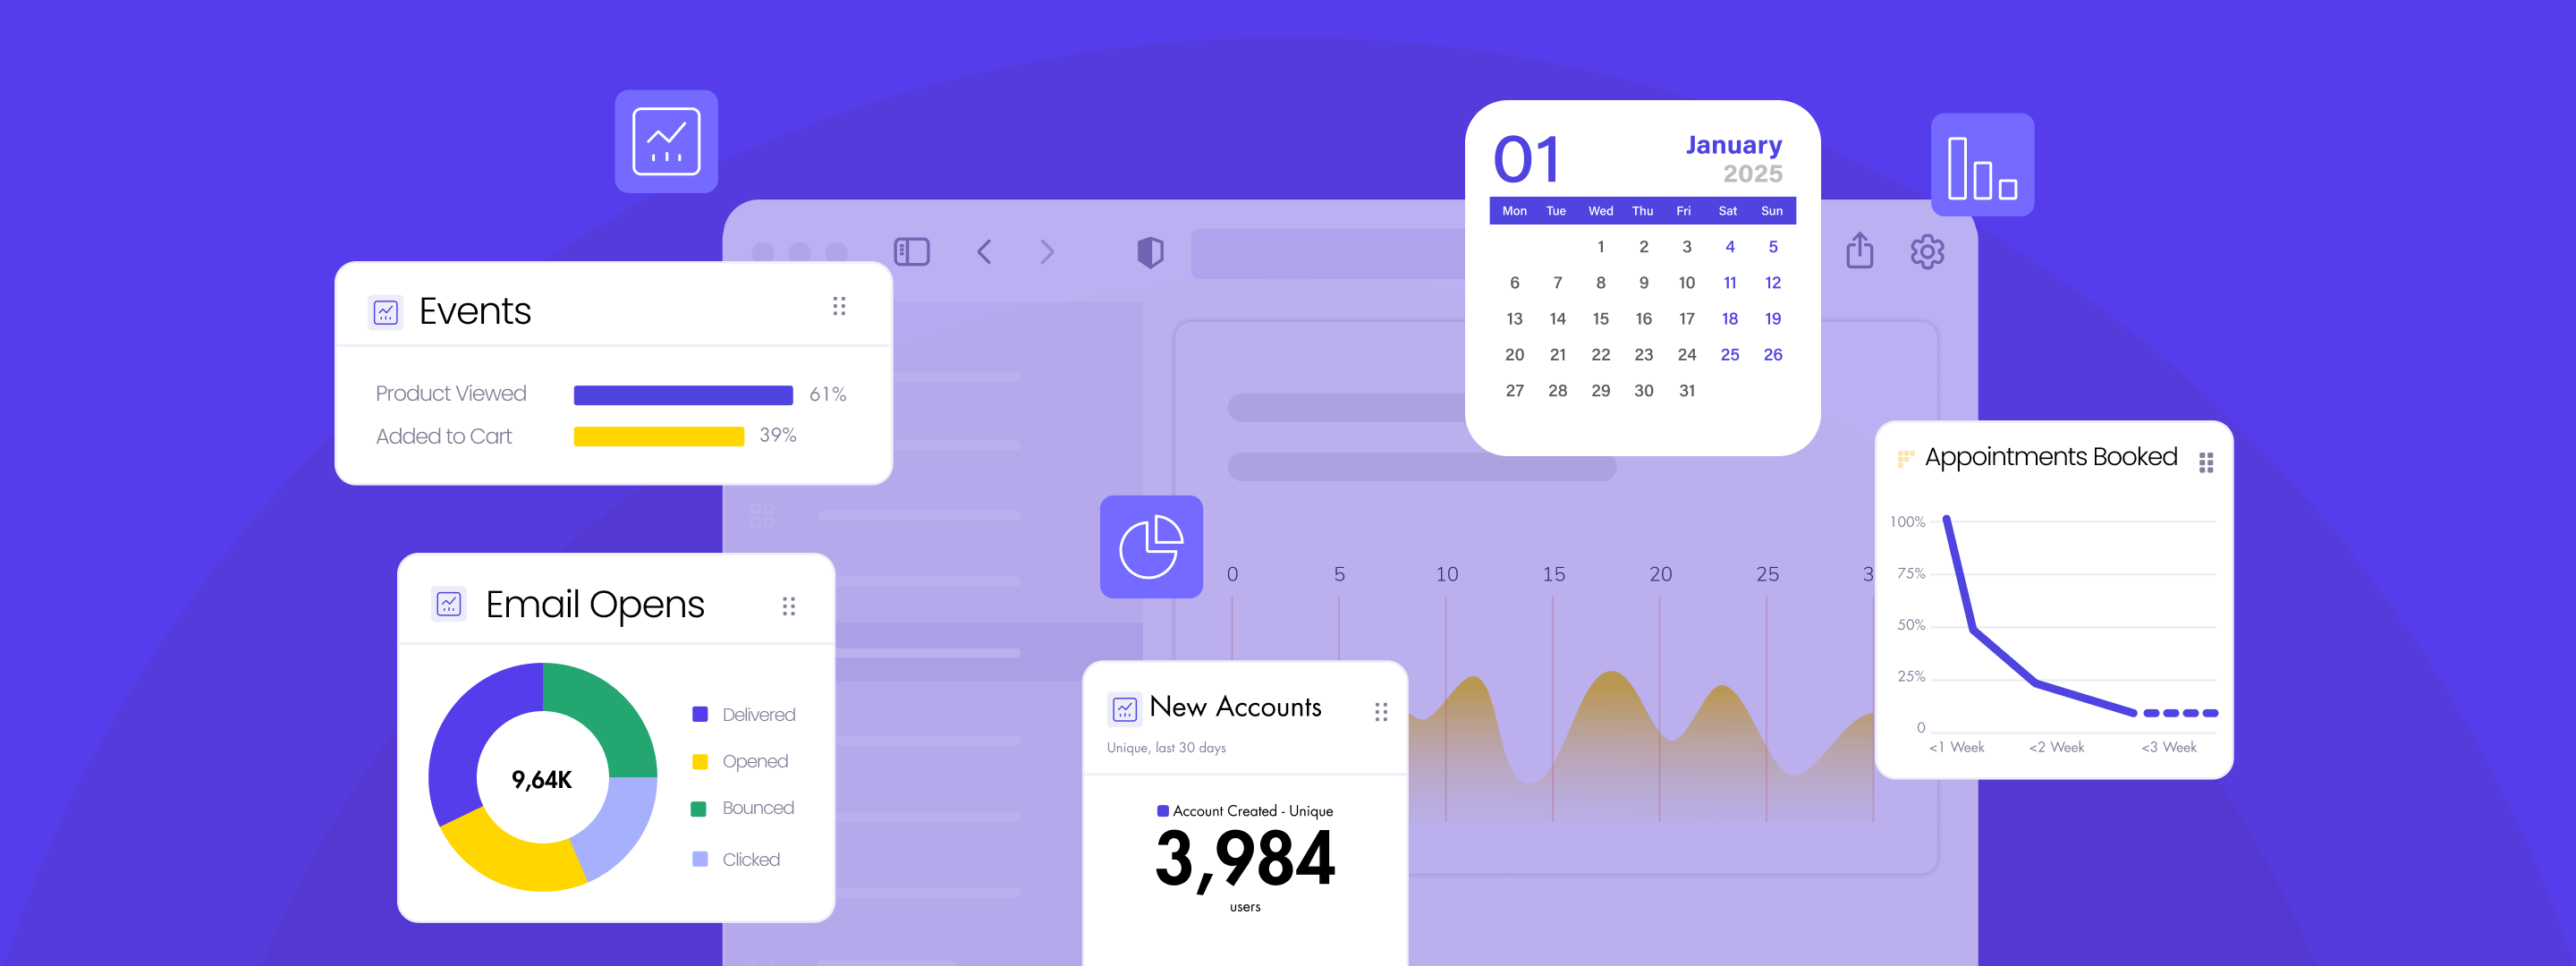
Every data point tells a story, but sifting through complex analytics shouldn’t hold you back. At WebEngage we’re committed to helping you make the most of your data, so we’ve revamped our Event Analytics UI.
These upgrades, designed with you in mind, improve your analytics experience by making it sharper, simpler, and faster. From enhanced visualizations to more intelligent filters, we’ve taken every step to ensure you can effortlessly turn raw data into actionable insights.
Let’s look at what’s changed and how these updates empower you to get more from your data.
Key Highlights: What’s New?
1. Enhanced Event Management Panel

- Add and Organize Effortlessly: Seamlessly add and manage event cards to fit your workflow.
- Flexible Panel Alignment: Align the configuration panel on the left or right based on your preference.
- Holistic Data View: View events as Occurrences, Uniques, or Aggregates to get a complete picture of user behavior.
- Simultaneous Insights: Analyze both Occurrences and Unique users for the same event (eg. Session Started) in a single view.
- Aggregates for Deeper Insights: Dive deeper into metrics like average cart value, minimum or maximum purchases, and popular product categories for a richer understanding of behaviors.
- Quick Card Actions: Hover over event cards to quickly filter, delete, remove, or duplicate them for streamlined event management.
2. Smarter Data Visualizations

- Flexible Time Windows: Analyze trends over varying time ranges—from today to the last 12 months—or use custom date ranges.
- Dynamic Visualization Options: Switch between Line Graphs, Bar Graphs, or Metrics for the preferred visualization format.
- Real-Time Interactions: Hover, click, or select data points for instant insights.
- Enhanced Features: Pin critical charts to your dashboard, set custom alerts for key events, or highlight specific time intervals to focus on trends.
- Consistent Time Series: Enjoy clarity with a standardized time series on the X-axis, ensuring your data is always easy to interpret.
3. The All-New Data Table

- Expanded Views: Toggle between side-by-side, table-only, or chart-only modes for more flexibility.
- Increased Capacity: Analyze larger datasets with support for up to 2,000 series (up from the previous limit of 50.
- Intuitive Sorting: Easily sort by any column to structure your analysis.

- Focused Exploration: Isolate specific series within dense datasets for sharper trend identification.
Pro Tip: Isolating a series automatically resizes the chart, making it easier to spot trends and outliers, even in complex datasets.
4. Individual Event Filters

Fine-tune your analysis by filtering data at the event level—directly from each event card:
- Flexible Filtering Options:
- Filter by Custom Attributes (e.g., category name, URL etc.)
Example: Identify users who added Sunglasses to their cart on the Summer Sale landing page. - Filter by System Attributes (e.g., device type, country, etc.)
Example: Analyze users who completed a purchase on Android devices in India. - Combine both for hyper-targeted insights.
Example: Find users who viewed the Product Category – Bags on iOS devices in Mumbai. - Quick Edits on Hover: Simply edit filters on hover for instant adjustments.
- Filter by User Attributes: Use attributes like Number of Visits, Current Order Status, Loyalty Status, and more to narrow down your analysis.
Example: Analyze loyal users who visited your website more than 5 times in the past month. - Filter by Event Common Attributes: Apply shared event properties, such as Brand Name, Channel, Campaign Source, and others, to refine your data.
Example: Identify users who clicked on an Email for the new Winter Collection. - Filter by Lists/Segments: Include or exclude users based on Live, Static, or Predictive Segments. Specify whether filters apply to users in All, Any, Not in All, or Not in Any of the selected segments for deeper segmentation.
Example: Target users in the Predictive Segment – Likely to Purchase but exclude those in the Static Segment – No Interest. - Quick Edits on Hover: Simply edit filters on hover for a seamless experience.
- Two-level Data Split: Split events by up to two attributes simultaneously: a combination of user attributes (e.g., location, age group) and event attributes (e.g., product category, time of purchase).
Example: Compare users aged 25–34 across different locations who purchased smartphones during the holiday season. - Simplified Workflow: Previously achieved using Over and Split By filters together, this new approach simplifies the process while retaining the same powerful cross-attribute analysis logic.
- Data Table Integration: The resulting series are directly reflected in the table, ranked by average values for better visibility.
5. Common Global Filters

Refine your charts and insights by applying filters across the entire dataset:
6. Advanced Cross-Attribute Analysis

Take your event analysis to the next level with the new Split By Filter, enabling you to:
For more information on the UI upgrades, check out our Knowledge Base.
Practical Use Cases
1. Track Region-Specific Campaign Performance
What to leverage: Individual Event Filters & Common Global Filters
How it helps: Filter events to see how a campaign performed in specific regions, e.g., analyze event data for users in Mumbai who interacted with a Diwali Campaign. Combine this with a segment filter to target high-value customers in these regions.
2. Understand Purchase Behavior Across Categories
What to leverage: Advanced Cross-Attribute Analysis (Split By Filter)
How it helps: Use a two-level split to analyze purchases by Age Group (user attribute) and Product Category (event attribute). For instance, identify the top product categories among millennials during a sale period.
3. Spot Trends in High-Traffic Days
What to leverage: Smarter Data Visualizations
How it helps: Highlight time intervals, such as weekends, to track spikes in traffic. Dive deeper into those days to understand patterns in session starts or checkout events using dynamic visualizations.
4. Discover High-Value Products
What to leverage: New Data Table with Series Isolation
How it helps: Sort data by revenue generated and isolate the top-performing product series to find items driving maximum sales. For dense datasets, focus on a specific series to uncover trends without clutter.
5. Analyze Multi-Device User Engagement
What to leverage: Individual Event Filters & Global Filters
How it helps: Filter event data to understand how users engage across devices, e.g., track users who visited your website via mobile and later made a desktop purchase. This helps refine omnichannel marketing strategies.
Wrapping Up
With these powerful upgrades, Event Analytics is now more intuitive, flexible, and insightful than ever. Every upgrade is designed to help you uncover deeper trends, simplify workflows, and make data-driven decisions effectively.
Starting 12th February 2025, we will be migrating all accounts to the new and improved Event Analytics UI. Rest assured, your old pinned charts will automatically transition to the updated interface as part of this migration.
Have questions or need assistance with the transition? Watch our demo video for a step-by-step walkthrough or reach out to us at product@webengage.com.




 Prakhya Nair
 Niket Raja
 Ananya Nigam