


Email is an evergreen channel of engagement. With time, it has evolved to accommodate newer and more effective engagement-enhancing techniques. Even today, users can be drawn in with a catchy subject line, who then scan the content for information relevant to them and engage. But, how do you map these user engagement trends?
The answer is simple- by studying and analysing user clicks.
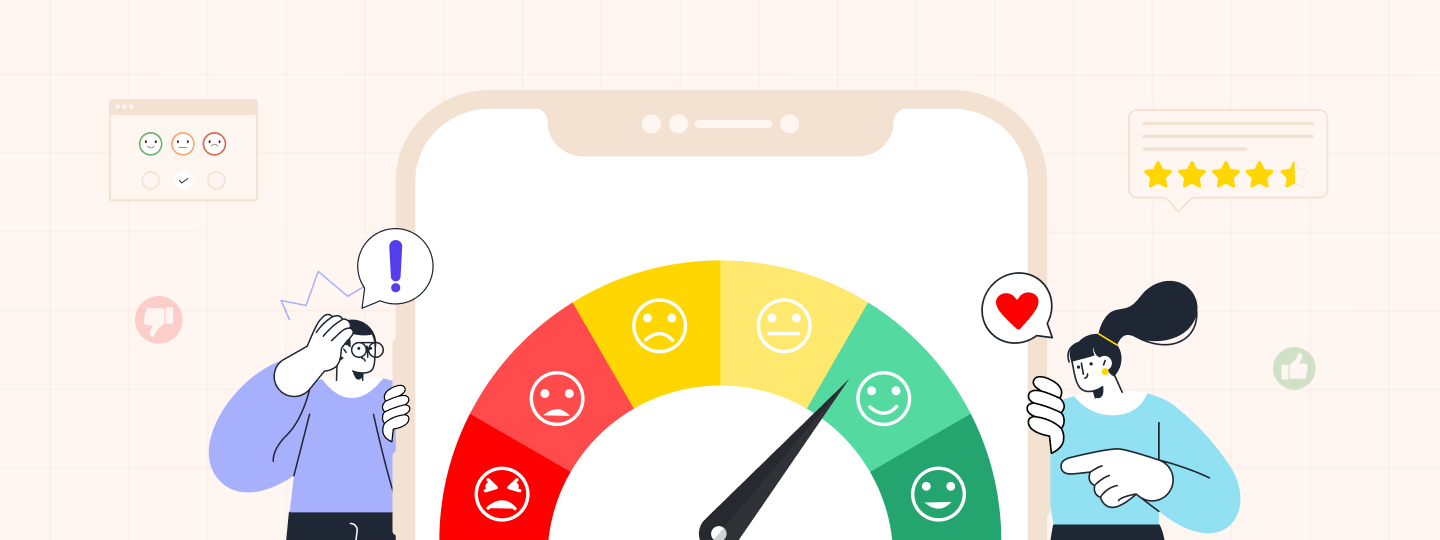
Every click brings the user closer to or further from completing a goal. If studied and analysed correctly, you can gauge which parts are persuasive enough for the user to click on or ones with low click-through rates and require extra attention. Hence, clicks can act as a genuine user data goldmine!
Top Clicked Links: Direct Insights into User Engagement
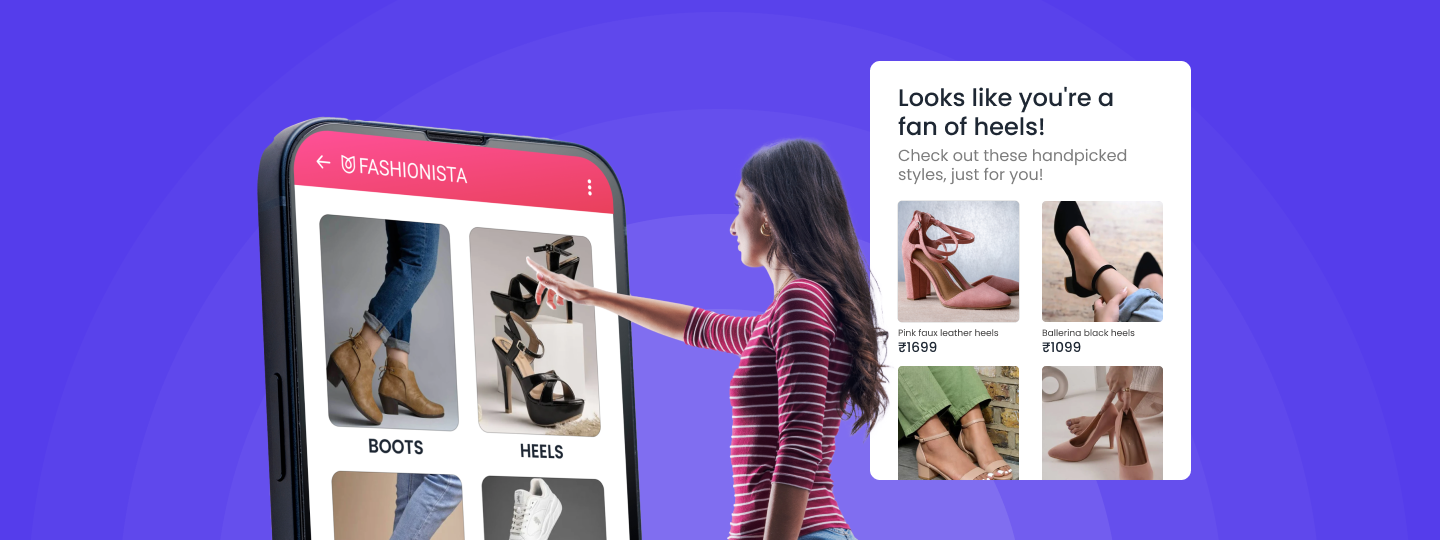
When users receive emails, the content and links shown to them differ depending on their data. With WebEngage’s Email Top Clicked Links, you can analyze the links clicked by a user. This gives you a clear picture of the users engaging with your content, interested in your offers or learning more about your brand.
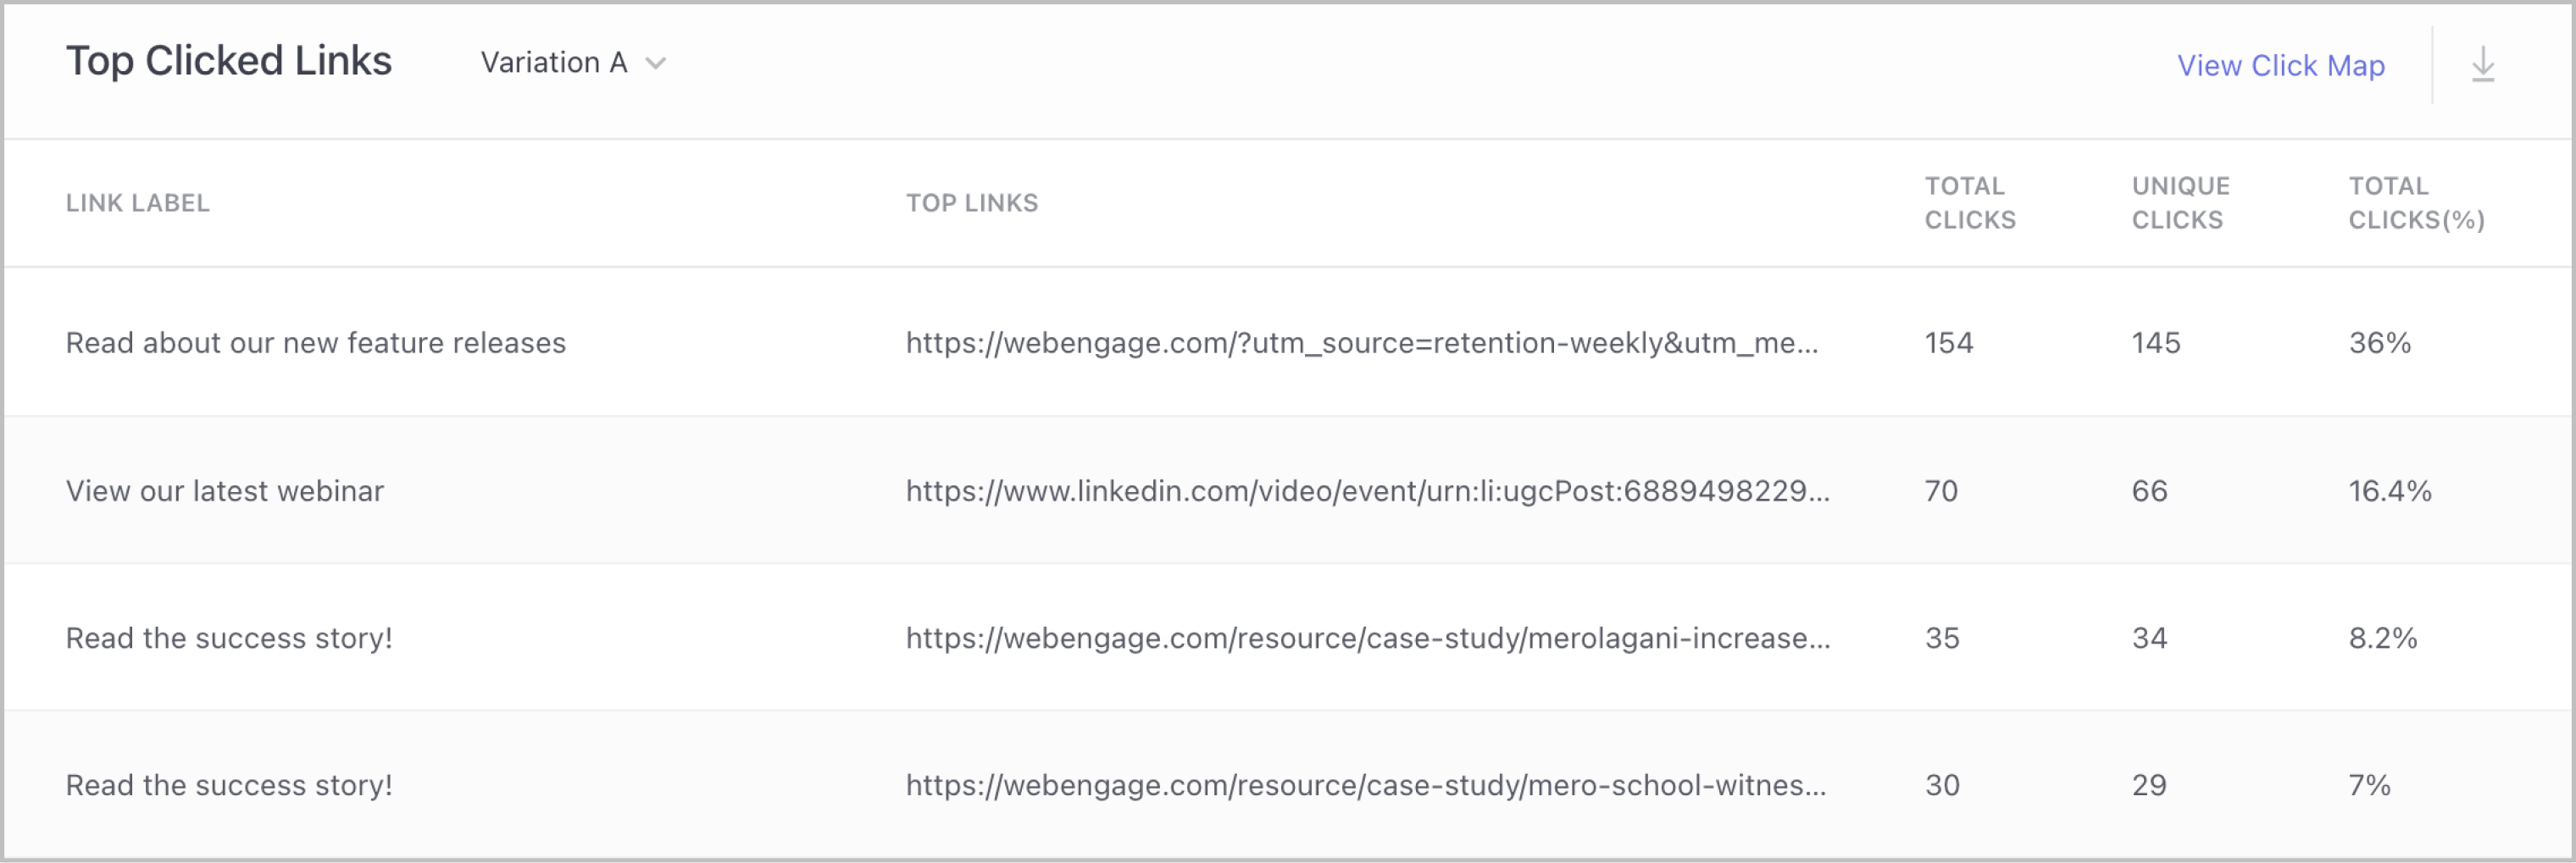
For example, an e-commerce brand shares an email with its users listing products they purchased, suggestions for similar products and a scale to rate their overall experience. With Top Clicked Links, marketers can see the links from the email users clicked in the descending order of clicks. It can also get other insights like Total Clicks, Unique Clicks, and Total Click Percentage and download the Total Clicked Links report for the email. Read our knowledge base for more information.
To make things even easier and more efficient for you, we have now added Visual Click Maps, i.e. a visual representation of these clicks.
Analyse User Engagement with Click Maps
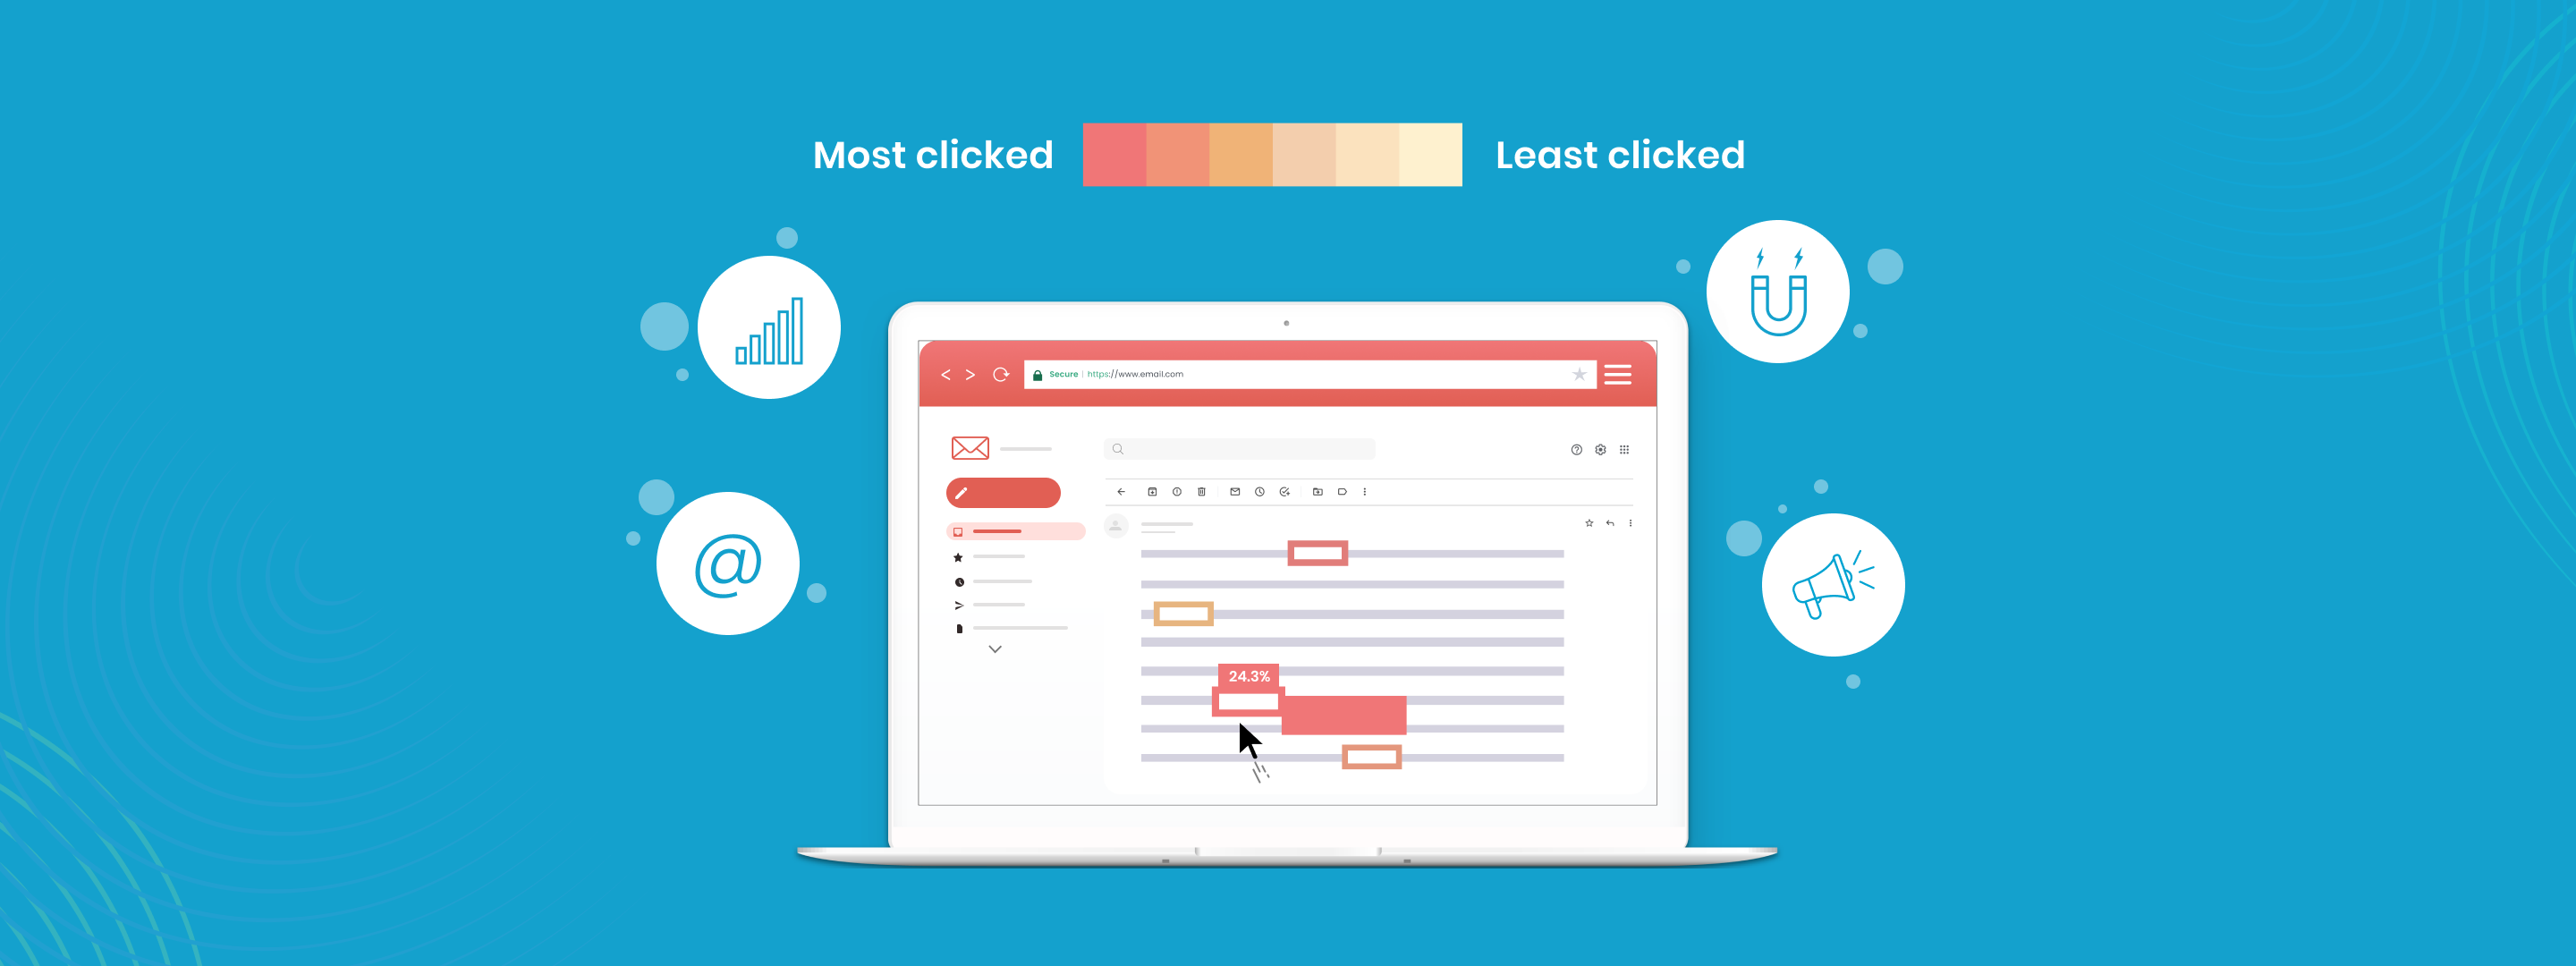
WebEngage’s Email Click Maps are the visual representations of links that users have clicked in the email. They provide a way to compare link performance and understand where the users are clicking (or not clicking). Thus, shedding light on behavioural patterns and providing actionable insights on factors such as location, design, etc., impacting the performance of links.
Want to know why click maps are worth your time and resources? Because with click maps, you can:
- Understand user behaviour and personalise user experience,
- Boost engagement and improve conversions,
- Understand what elements are performing well or underperforming,
- Update your design, marketing and sales strategy and improve your email layout or content accordingly, and
- Track Return on Investment (ROI); understand the response to your investment in email campaigns.
To help you understand their implementation, here are some use cases:
- If you notice that call-to-action buttons draw more attention than text or image links, you might decide to use them more often or make them more prominent, in terms of their positioning.
- If your visitors are opening the email, but there are no clicks before they close/delete it, you can experiment with a different content strategy or also re-look at the target audience to make the message more contextual.
- If you have different call to actions in your email, e.g as an Edtech brand if you are promoting different courses users can sign-up for, visual click maps can easily help you identify the preferred courses.
How to get started with ‘Click Maps’ in WebEngage
When you analyse your email campaigns on the campaign overview page, scroll down to the ‘Top Clicked Links’. Then,
- Select ‘View Click Map’ and you will see a preview of the email, where the data for each link in the Top Clicked Links table will be mapped to its own ‘Link Label’.
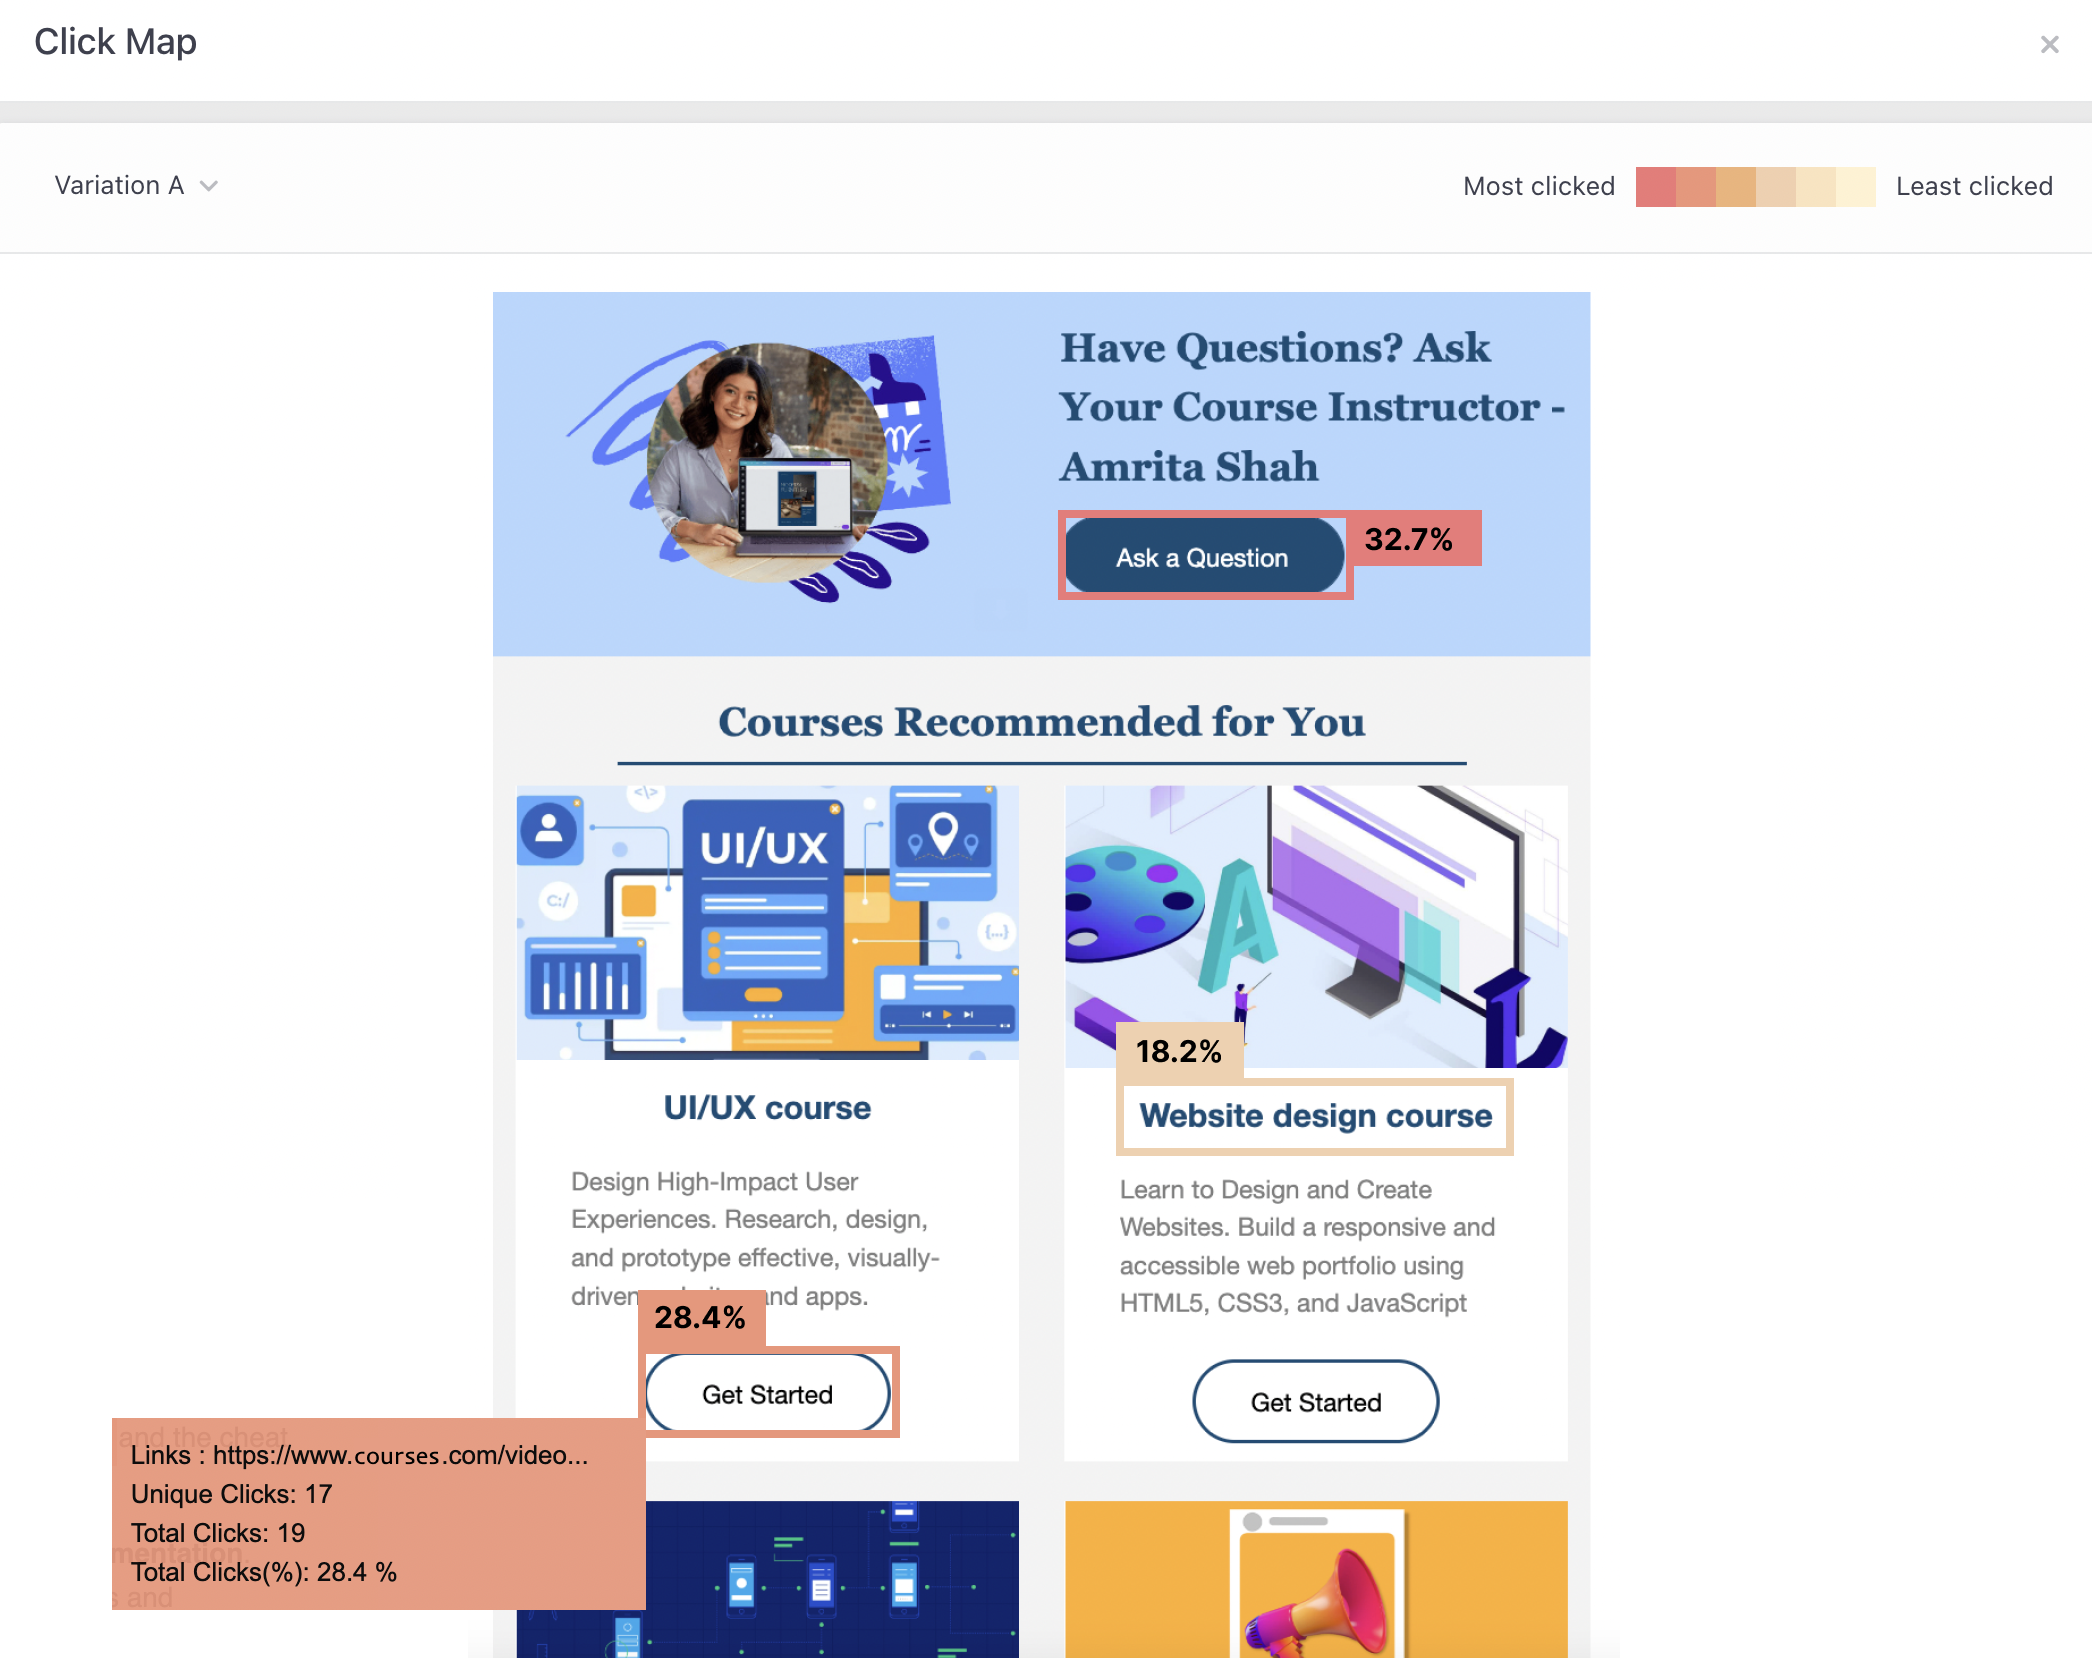
- Links with more clicks will be darker, while those with fewer clicks will be lighter. On hovering, further details of the link will be shown.
Wrapping Up
With click maps, you receive clarity on the changes required in your email content, calls to action or general layout. This clarity is based on actual user needs rather than your best guesses, thus helping you maximize your ROI.
We hope you try out these features and share your feedback. Read our knowledge base for more information. If you need more assistance, get in touch with your Customer Success Manager or reach out to product@webengage.com to get started.
Test and measure the impact of your campaigns with WebEngage. Take a demo today!
Get the best industry knowledge at zero cost!– Subscribe to our weekly newsletter with a single click and stay ahead of the curve.

 Niket Raja
 Ananya Nigam