


Last year, we launched a composable version of our Customer Data Platform; CDPx, and introduced Entities – a simple way to house data pertaining to customer relationships in WebEngage so that you could use it further for your customer segmentation and lifecycle campaign orchestration. Relationships between these entities can get complex depending on your business. We are introducing an Entity Relationship Visualizer just for you!
Before I get to the ER visualizer, here’s a quick summary of what CDPx is meant to unlock for you – all modern day customer engagement platforms let you store two types of data:
a. Users – customer/lead information enumerated via multiple stored attributes
b. Events – actions performed by these users with data captured around their behaviour/actions/transactions etc
These two data buckets alone can’t capture the relationships between different customer data points, which you need for precise lifecycle orchestration. For example, say you sell appliances through your website or retail stores. You’d typically use a CEP like WebEngage to run intent-to-sales workflows that convert prospects into buyers. That part is simple enough.
But once the sale is done, you’d want to follow through with upsell/cross-sell workflows to sell relevant accessories or services (say AMCs) to these customers. These items have a lifecycle of their own.
For example, once an AMC is sold, you’d want to remind customers about bundled services and nudge them to renew before it expires. To manage these kind of workflows, the objects Appliances and AMCs need to be stored in your CEP with their true definitions. Furthermore, these are not standalone objects. They are related with each other, and ultimately tied back to the customer.
This is exactly the problem WebEngage’s CDPx solves. In CDPx, customer records like Appliances and AMCs are modeled as CDPx Entities. Depending on your business, Insurance Policies, Customer Loans, Vehicles Owned, Lab Test Appointments etc can be Entities that you could model in WebEngage’s CDPx. These Entities live inside our CDPx as first-class objects, with their own attributes, lifecycles, and relationships to Users and to each other.
I am glad you have come this far 🙂 Before I move to the actual theme of this post (the Entity Relationship Visualizer), here’s a quick video explaining what CDPx Entities can do for you..
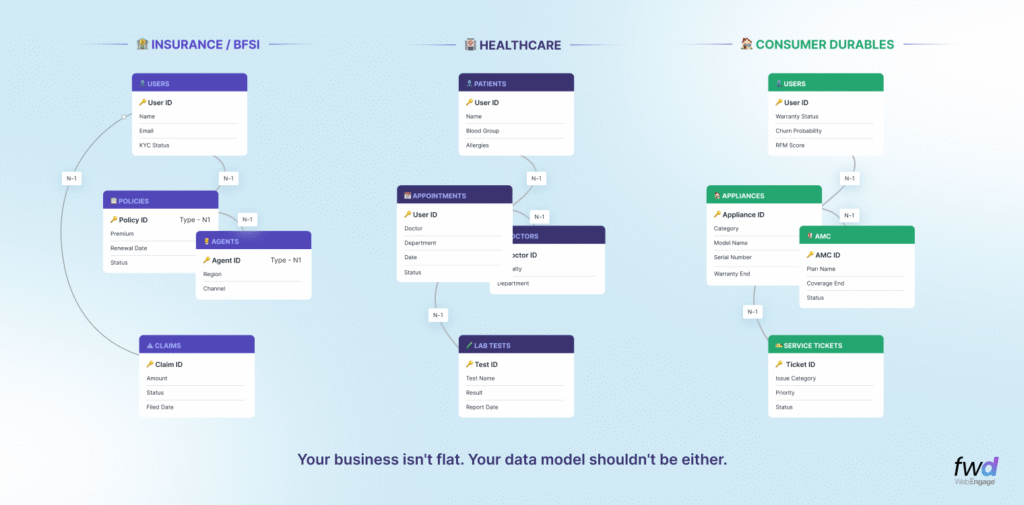
Since the launch of CDPx our customers across multiple verticals including Financial Services, Healthcare, Automobile, Consumer Durables etc, have started structuring their customer data in the way their business actually works. And that’s when a common challenge surfaced; the more entities and relationships they wanted to bring inside WebEngage, the harder it got to manage what connects to what.
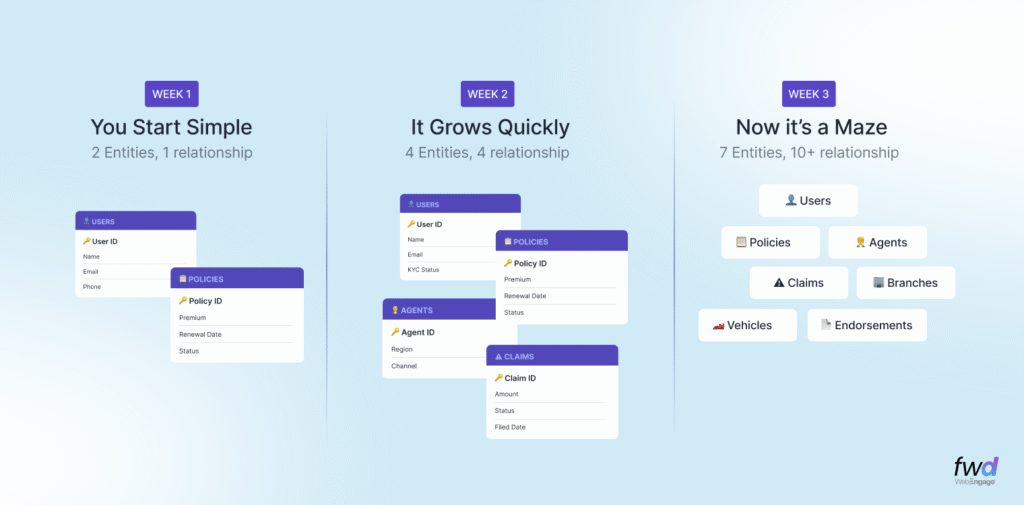
Case in point – one of the largest digital insurers in India uses WebEngage as their CDP-cum-CEP. They switched to CDPx. In the first week of the switch, they set up two entities – Buyers and Policies. That was simple relationship. As soon as they moved that data, they added Agents and Claims. Four entities, four relationships, all related to each other in multiple ways and very hard to manage for operating/data teams as they also need to work on these respective data pipelines to add/update the data for these Entities.
And, this problem is not limited to just the insurance company mentioned above. Every customer that uses Entities ends up with its own tangled web of data sources and data flows; Healthcare Providers have Patients, Appointments, Doctors, and Lab Tests; Consumer Durable Companies have Customers, Appliances, AMC Contracts, and Service Tickets.
Introducing Entity Relationship Visualization (ER Visulazier / Diagrams)
Today, we’re thrilled to introduce the Entity Relationship Visualizer – a visual, interactive canvas that lets you manage your custom entities and their relationships.
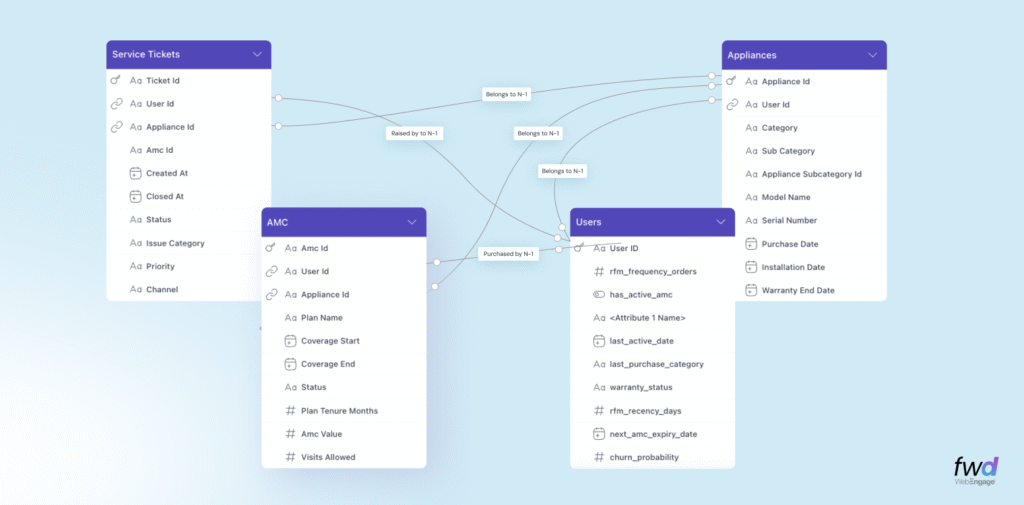
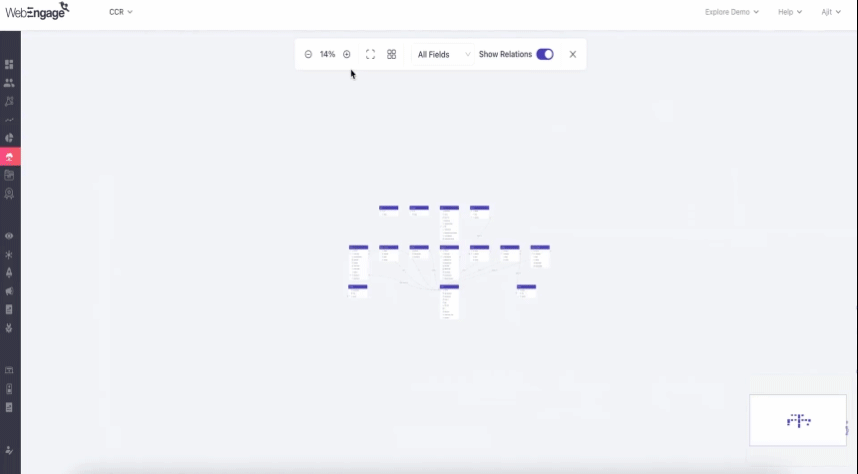
With the Entity Relationship Visualizer you get an interactive canvas inside your Data Management > Custom Entities section of your WebEngage dashboard. It renders all your custom entities as visual cards, displays all attributes within each of those, and draws the relationship connectors between all the entities. The visualization is complete with cardinality labels and relationship names as defined by you.
Here’s what you get out of the box…
1. Bird’s-eye view of your data model
See all your entities, their attributes, relationships, on one screen. No spreadsheets, no ER diagrams in charting tools that go stale with your evolving data model. WebEngage CDPx is your ultimate source of truth for customer golden record. We are building everything that you’d need to help plan your data infrastructure better.
2. Entity relationship connectors with labels
All connection between entities display the associations (as verbs) that define their relationships (e.g., “belongs to”, “purchased by”, “raised by” etc) and show their relationship cardinality (e.g., many-to-one, one-to-many, or one-to-one etc)
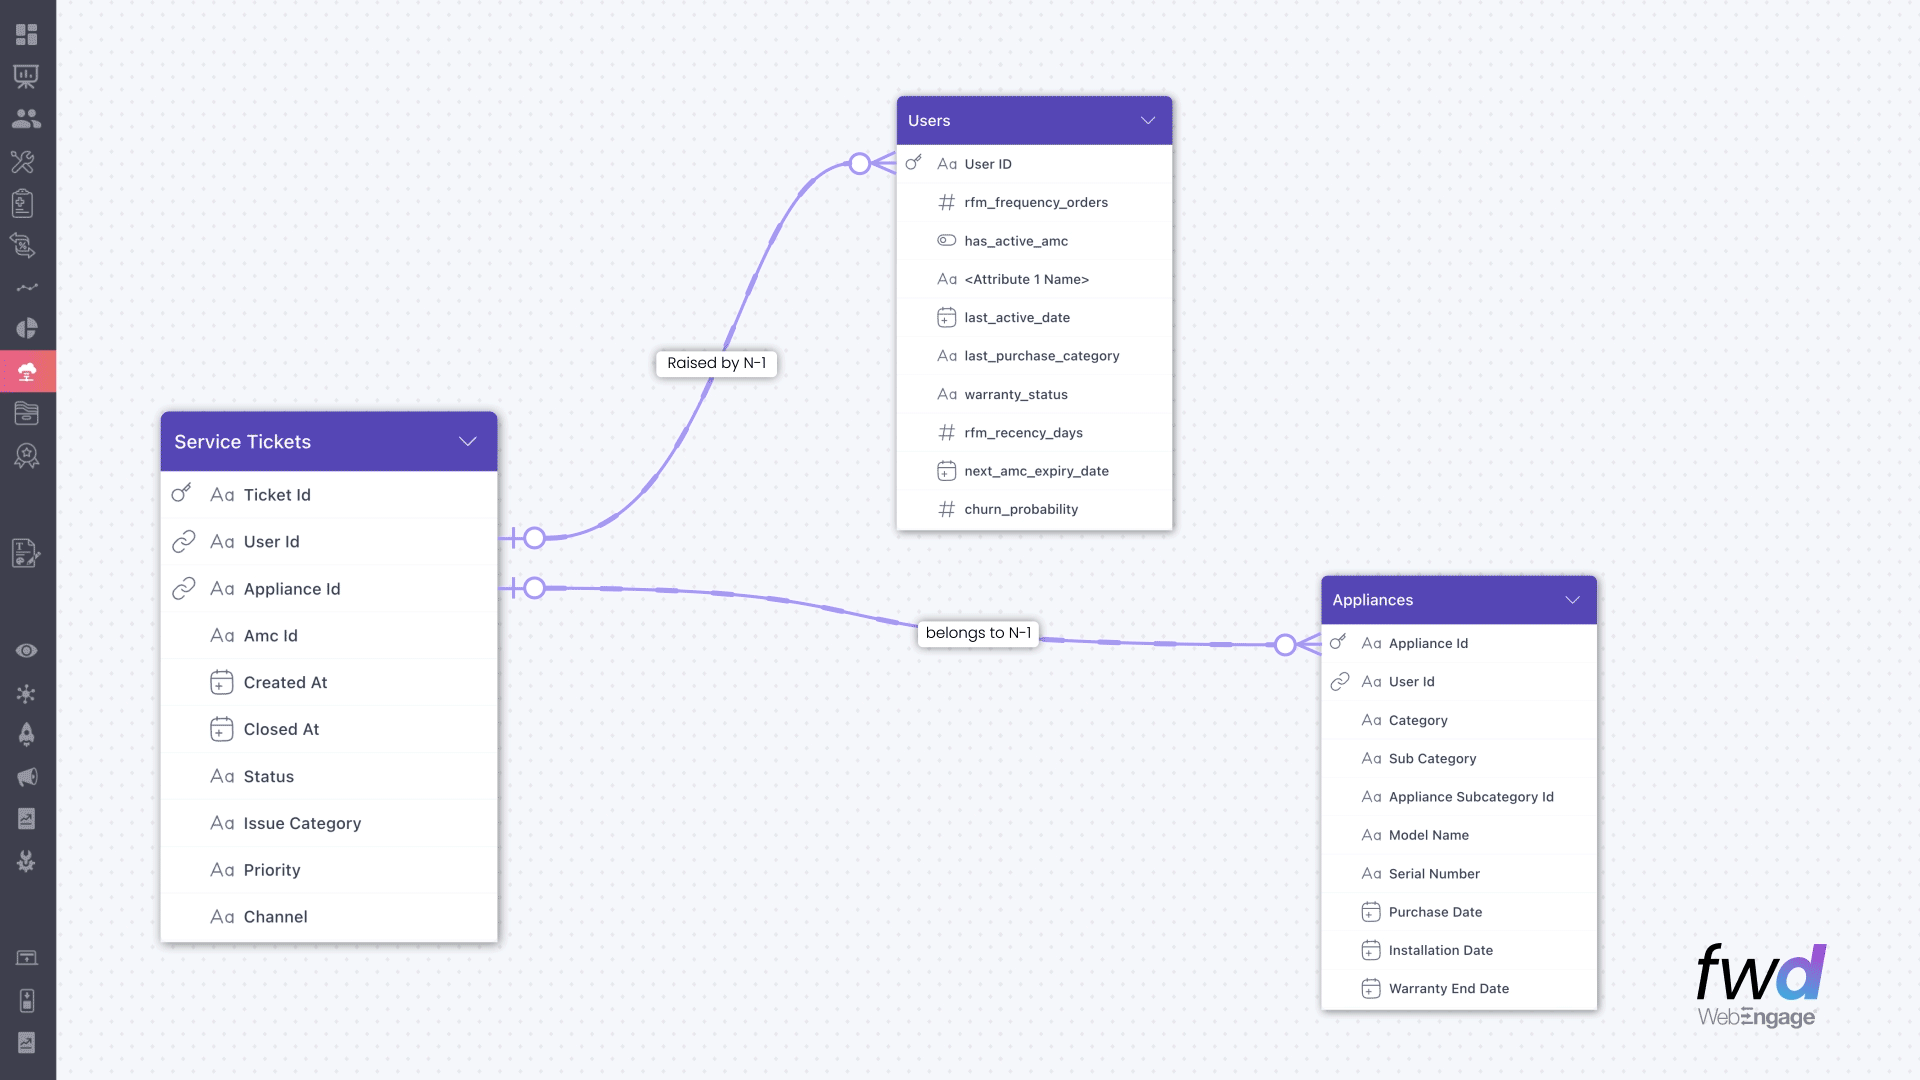
In the visualizations above, you can immediately infer that a User may purchase many Appliances with AMC Contracts. A User may create multiple Service Tickets against an Appliance that the User owns. I can go on, but you get the drift..
3. Interactive zoom and layout controls
Zoom in and out to inspect a specific entity’s schema or to get the full data model. The canvas is draggable, so you can rearrange the view to focus on the area you’re working on. Of course, you can move these Entities to let it truly reflect your data-flow and relationship hierarchy.
What good is all this data if you can’t put it to use? Here’s how you can use your CDPx Entities in Segmentation..
Coupled with a flexible criteria builder, the brand new Affinity function and an iconic new user experience, WebEngage Segmentation now unlocks campaign activation like never before. With our Segment AI Agent, you don’t need to build these segments manually either. Just chat with our Segment Agent and you are good to go!
Getting started
If you’re using CDPx, the Entity Relationship Visualizer is available in your dashboard right now. Navigate to Data Management > Custom Entities and you’ll find this visual canvas ready for use.
Should you wish to upgrade to CDPx, please get in touch with your Account Manager or Growth Consultant to get it activated in your account.


 Prakhya Nair
 Niket Raja
 Ananya Nigam
 Diksha Dwivedi