


What is the most suitable and sustainable way to grow your business? While the most obvious answer is to acquire new customers, most business leaders believe that customer retention is the key to profitably growing your business while reducing the cost of customer acquisition. The cost of running high-conversion ads is going up and the number of people being reached is going down. It costs money to generate leads, create a brand image, and push customers to take that first step. All the money, time, and efforts of acquiring a new customer are wasted if you do not retain your existing customers. In the article below, I’ve listed the various customer retention metrics you need to track to be at the top of your retention game.
An effective customer retention strategy will enable you to forge lasting relationships with your consumers who then become loyal to your brand eventually. They might even spread the word about your brand within their circles, influencing the purchase decisions of their peers and networks, resulting in increased revenue for your business. Call them brand ambassadors if you may.
5% increase in your retention rate can increase your profitability by 85% (Source)
All leading brands today are advocates of customer retention and rightfully so. Customer churn has a drastic impact on your bottom-line figures. While focusing on customer acquisition can increase your revenue, it dramatically reduces your profitability per transaction.
How do you calculate ‘Customer Retention Rate’?
Customer retention rate designates the percentage of customers that your business has managed to retain over a certain period. Retention rate is the reverse of churn rate, where churn rate is the percentage of customers you have lost in the same period. The importance of retention rate as a metric varies from industry to industry and is very critical in increasing the profitability of a business.
The most common way of calculating customer retention rate is:
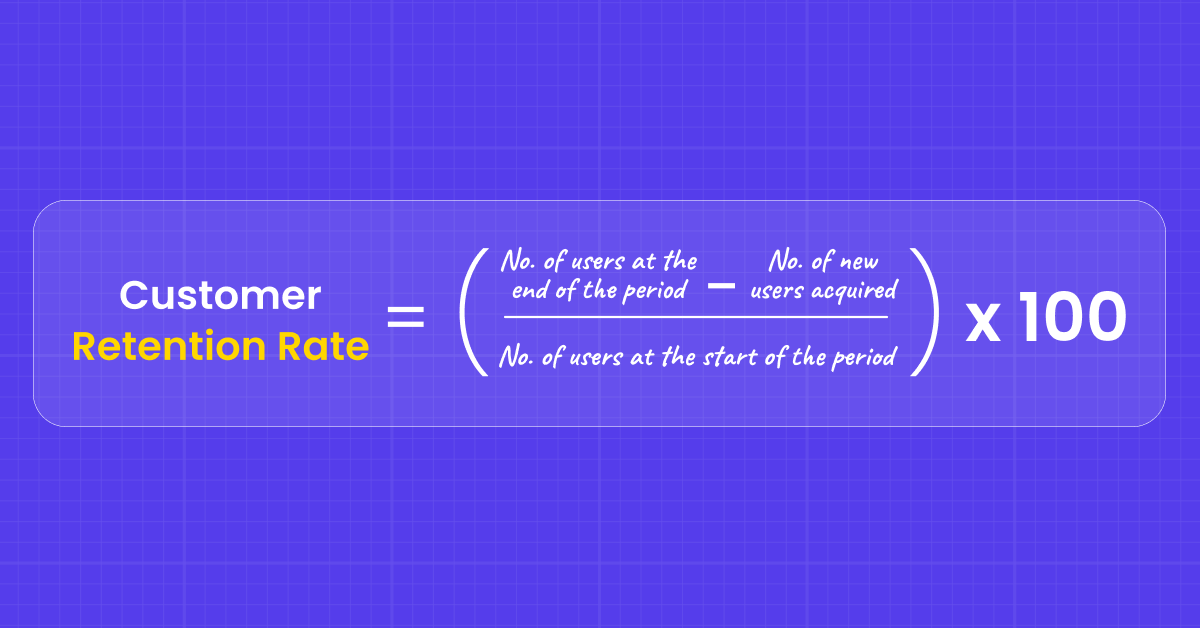
So, for example, say you launch a product. On the 1st of January, you had 1000 customers and by the 30th of January, you were able to get 500 new customers. However, during the same period, you lost 200 customers. So effectively, the number of customers at the end of the period (in this case 1 month) is 1300 customers.
So your current retention rate is (1300-500)/1000 = 0.8 or 80%
How does reducing churn rate/increasing your retention rate, impact your bottom-line figures?
Let us take an example of a business X. They are about 8 years into the business and have an annual maintenance contract (AMC) for providing their services to about 5000 remote workers across Tier 1 cities in India. For August, they started with 5000 paying customers. During the month they acquired 300 new customers and ended the month with 5100 customers.
The effective churn rate for business X is 4% and consequently, the retention rate is 96%
Now say the average ticket size for company X is ₹2000. So, just for August, lost revenue for business X is:
Lost revenue=Average ticket size*(Customers at the start of the month+New customers acquired during the month-Customers at the end of the month)
This makes the lost revenue for Business X for the Month be equal to ₹400,000
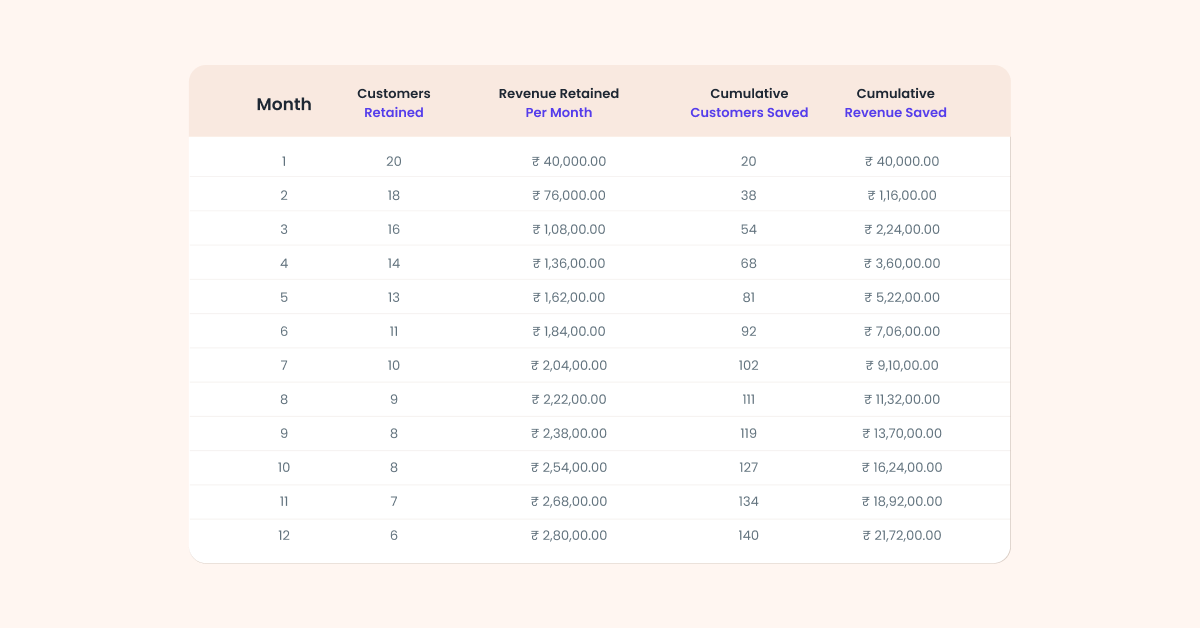
Now say the CEO of business X decides he wishes to reduce customer churn by 10% MoM. This means that of the 200 customers he was losing every month, he wishes to retain 20 of them in the first month. This means that in the first month itself he has saved ₹40,000. In the subsequent month, he will retain 18 customers, 16, 14, and so on.
Here is a breakup of the revenue saved due to retaining lost customers over 12 months:
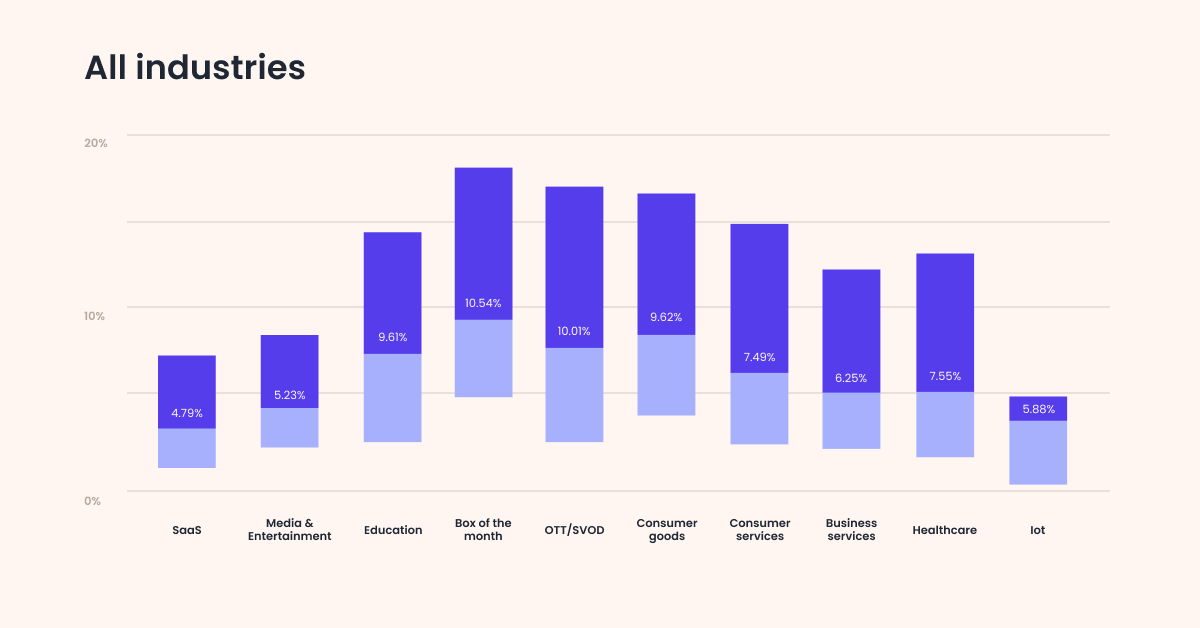
Here is a benchmark of average retention rates by Industries:
While customer retention is an amazing metric to signify the health of a business, it is not the only metric you need to track. There are a bunch of other metrics that help you get the customers’ pulse.
Here are some more customer retention metrics you need to focus on:
- CLTV/Customer Lifetime Value
- Revenue Churn Rate
- Net Promoter Score
- Repeat Purchase Rate
- Customer Churn Rate
- Average Order Value
- Profitability Per Order
- Loyal Customer Rate
- Time Between Purchases
- Customer Growth Rate
- Product Return Rate
- Days Sales Outstanding
- Share of Wallet
- Customer Satisfaction
- Customer Retention Cost
- CAC/Customer Acquisition Cost
We’ve also converted these into a downloadable calculator for you!
1. Customer Lifetime Value
CLV, CLTV, or Customer Lifetime Value is the net profit attributed to the entire future relationship with your customer. CLV helps in segmenting customers that are worth retaining and ones that do not need to be retained on priority. Customer lifetime value has an intuitive appeal as a marketing concept. In theory, you can assign a monetary value to each customer and assess the spending limits behind acquiring such customers. CLV helps in setting a benchmark for COA (Cost of Acquisition) and COR (Cost of Retention).
How to calculate Customer Lifetime Value (CLTV)?
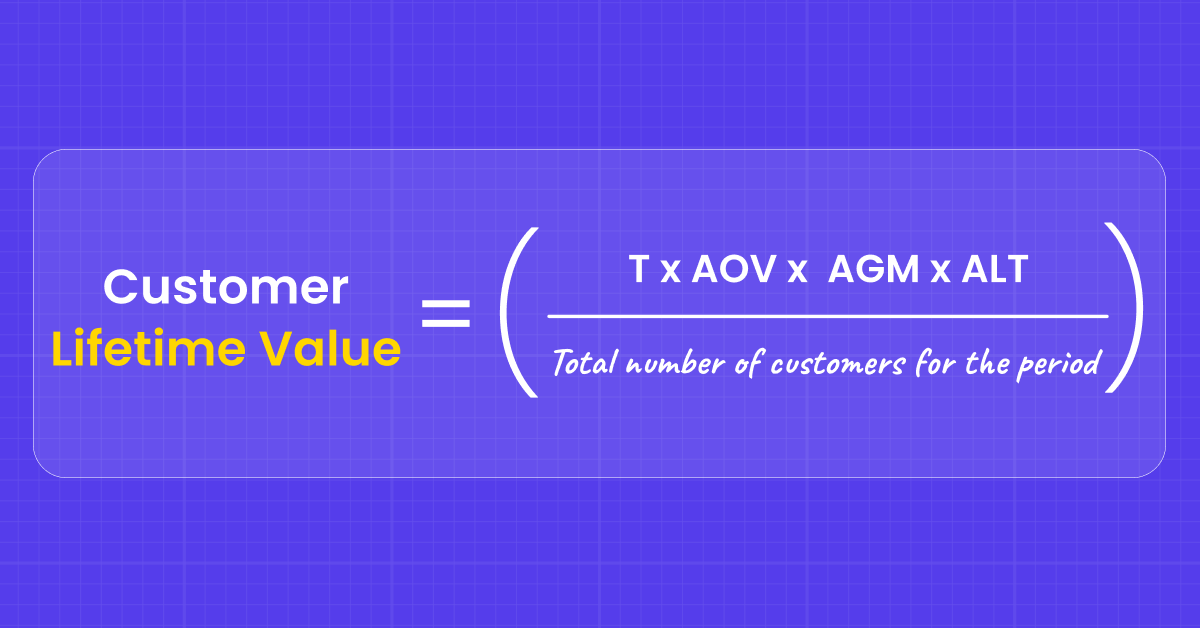
Where, T = Total Number of transactions per year,
AOV = Average Order Value
AGM = Average Gross Margin (%)
ALT = Average Customer Lifespan in years
Example:
Say you are a smartphone manufacturer and you’ve sold 2mn devices in 2019. Across your range of products, the average ticket size is $250. On every device you sell, your company has a gross margin of 15% after all the overhead expenses. Off the 2mn devices you sold, you attracted 1.8mn customers (including both new and retained customers). The average lifespan for your product is 1.5 years, or in other words, your customer is expected to make a repurchase in the same category (with your brand or any other competitive brand) in 1.5 years.
In this case your customer lifetime value is: (2mn*250*0.15*1.5)/1.8mn = $62.5
Now, if your COA is less than $62.5, the customer is deemed to be profitable and acquisition is acceptable.
2. Revenue Churn Rate
If your business provides various products/services at different prices, your revenue churn rate may be different from your customer churn rate. Revenue churn rate is a metric to identify which of your products/services are performing poorly and helps in making strategic improvements in the retention plan. The basic formula for calculating revenue churn is similar to calculating customer churn. However, the insights derived from revenue churn are completely different from customer churn. Let’s learn how to calculate Revenue Churn Rate
How to calculate Revenue Churn Rate?
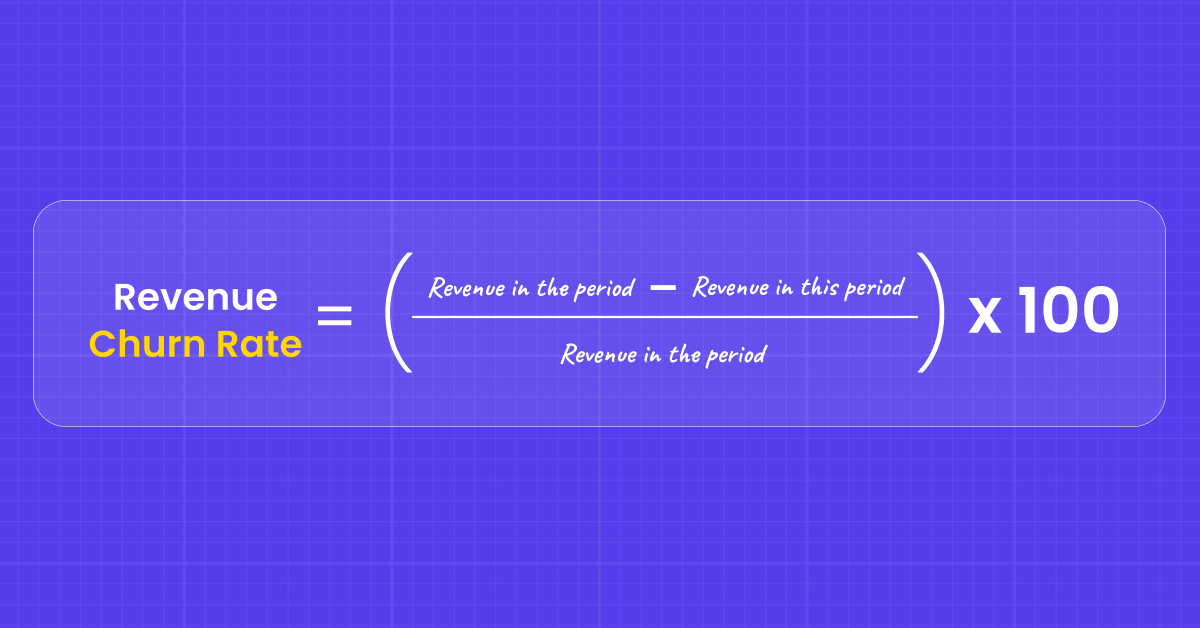
The period of consideration is usually a quarter as monthly revenue numbers may not always portray the best picture due to the smaller data size.
Example:
For FY 21-22, your revenue was $20mn whereas for FY 22-23 it was $18.5mn. Plugging these values in the above equation gives the Revenue Churn Rate as (20mn-18.5mn)/20mn = 7.5%
This method of calculation is excellent if you have a single product offering. However, for multiple offerings, it is advised to calculate revenue churn for each product individually.
3. Net Promoter Score
NPS or Net Promoter Score is a measure of identifying a customer’s likelihood of recommending the product/service or the brand to their family and friends. Created by Bain & Co., NPS has evolved way beyond a score and is now implemented as an organization-wide system to drive customer-centricity.
How to calculate Net Promoter Score?
To calculate NPS, customers (through feedback mechanisms) are asked to rate the likelihood of them recommending the product/service to their family and friends on a 0-10 (11 point) scale. Customers, based on the rating they provide, are classified into 3 categories:
Detractors: 0-6
Passive: 7-8
Promoters: 9-10
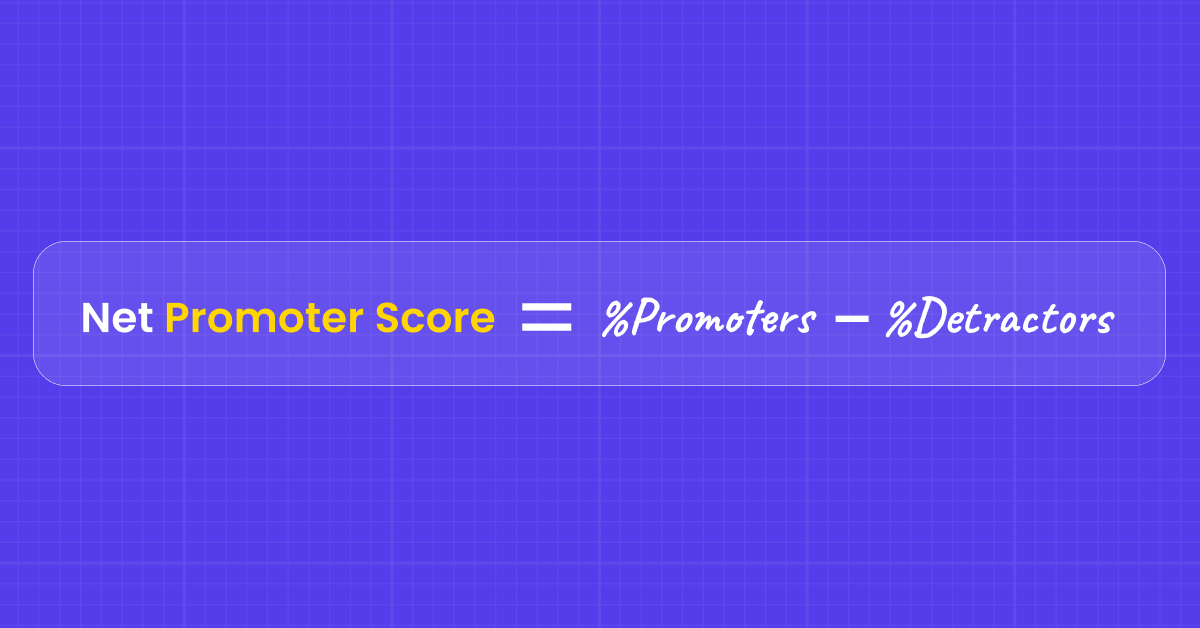
Note: Passives are not taken into account while calculating NPS. However, Passives play a major role while calculating the % of Promoters and % of Detractors.
Example:
If you have 1000 respondents of which 200 are detractors, 400 are passives and 400 are promoters, Your NPS = [(400/1000) – (200/1000)]*100 = 20. In theory, there is no good or bad NPS score. However, you may want to compare your score with the industry average and focus on incremental improvements (month-on-month).
The NPS scale can range from -100 to +100 and can be individually calculated basis feedback captured at every touchpoint across the customer journey.
4. Repeat Purchase Rate
Very simply put, the Repeat purchase rate is the percentage of customers who shop more than once with your brand. Repeat purchase rate helps retailers understand the tendency of the customers to return after their first purchase and hence design their loyalty programs.
How to calculate Repeat Purchase Rate?
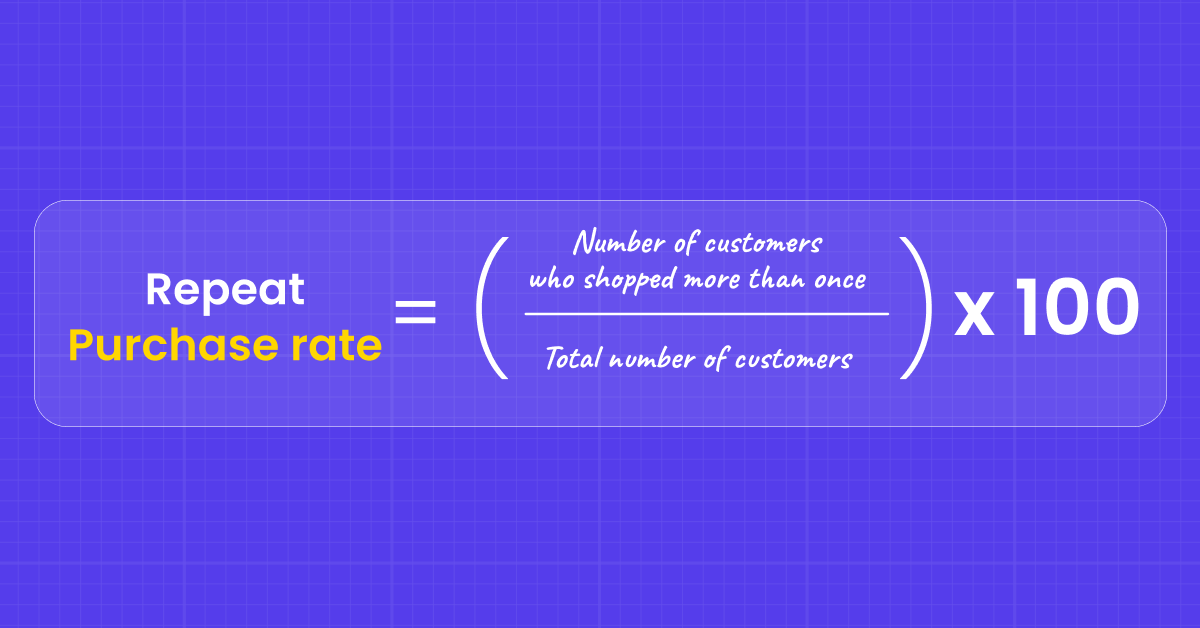
This is effective when you assume that within a given time-frame your customers shop with you not more than 2 times. However, when your customers shop more than 2 times, it has a compounding effect on your repeat purchase rate.
Example:
As an FMCG brand that sells ‘Iodised Salt’, you want to know what is your Repeat Purchase Rate for Q3 of 2022. An average bag of your product would last your customers about 4 weeks. Based on the hypothesis that due to the pandemic and subsequent shutting down of the services, a lot of your target group (TG) has now started preparing meals at home, the uptake of your product has increased. This hypothesis can be justified by a correlation between the Repeat purchase rate and revenue.
For Q3 of 2022, the total number of customers was 3.2mn and the number of customers who purchased more than 1 bag is 1.8mn. Therefore, RPR = (1.8mn/3.2mn)*100 = 56.25% which is 12% higher than Q1 of 2022. Hence the hypothesis stands true.
5. Customer Churn Rate
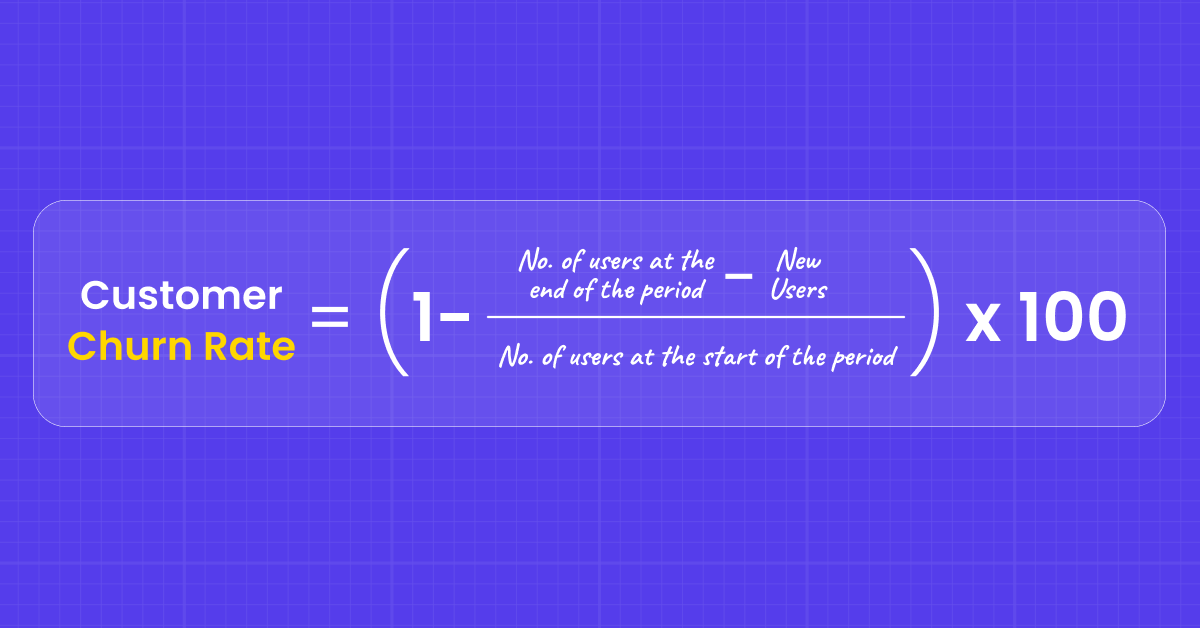
Customer churn rate is the percentage of customers your brand has lost during the period of consideration. Your period of consideration could be a month, a quarter, a year, but the most commonly used period is a month.
How to Calculate Customer Churn Rate?
Example:
If you started your month with 5000 customers, you were able to add 400 more customers and ended the month with 5100 customers, your current churn rate is 6% and your current retention rate is 94%
Under the properties of the equation you can also say that:
Customer churn rate = 100 – Customer retention rate
6. Average Order Value (AOV)
The average order value is the measure of the average ticket size per order. It is a simple measure to calculate the value of impact made by individual customers through their purchases. The more money a customer spends per order, the cheaper it is to advertise offerings to such customers. Bundling products, and suggesting products from complementary categories help in increasing the AOV per customer
How to calculate Average Order Value?
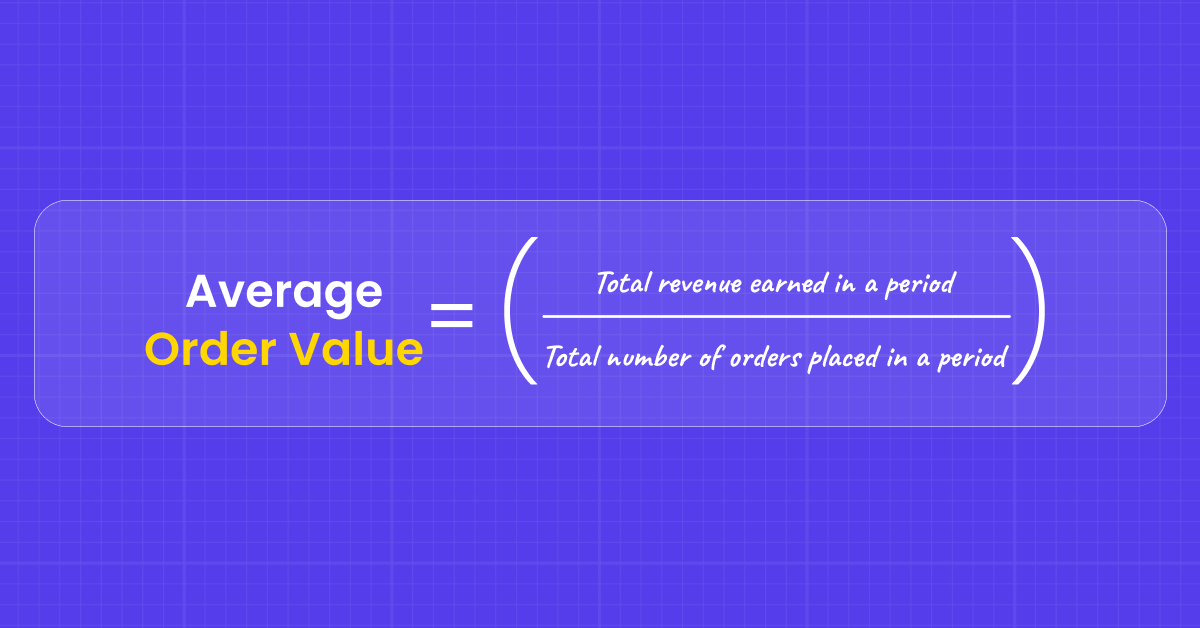
Example:
So, if for a business X, the total revenue generated for Q3 is $10,000 and the total number of orders received is 500 then the AOV = 10,000/500 = $20
7. Profitability Per Order
Similar to AOV, Profitability Per Order lets you calculate the profits earned per order. It is directly proportional to the overall profits earned.
How to calculate Profitability Per Order?
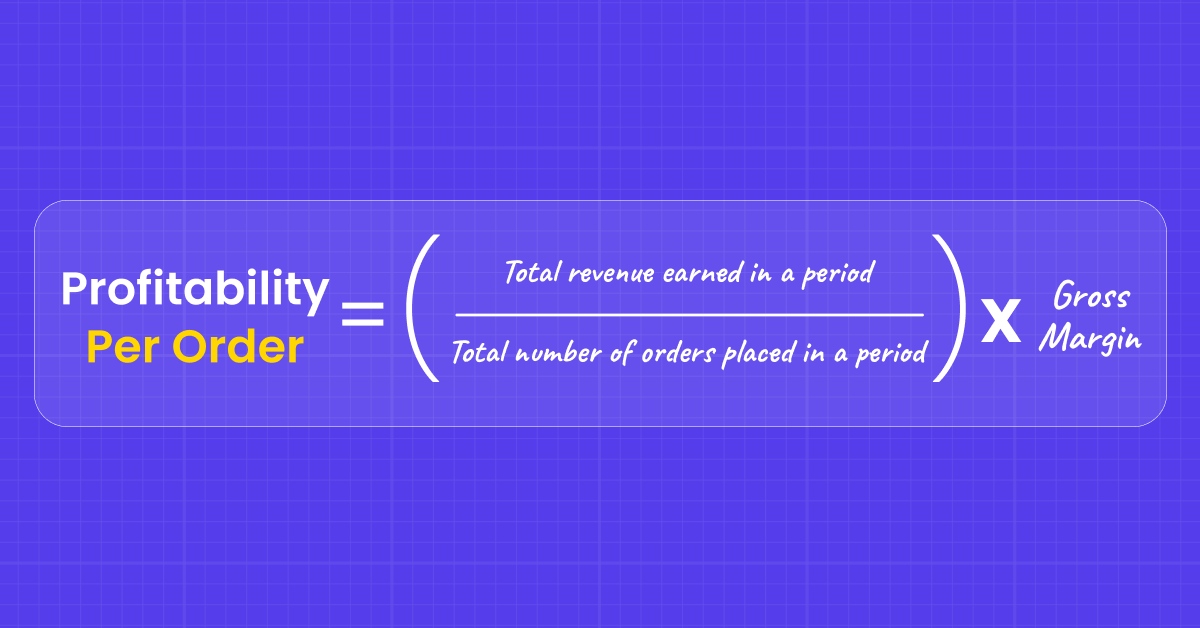
To increase the PPO, bundle high margin products with low margin products to increase the overall margins per order.
Example:
Based on the calculation from the previous equation, you found out that your average order value is $20 and you have a gross margin of 8% per order. This means your profitability per order is 0.08*20 = $1.6
8. Loyal Customer Rate
Loyal Customer Rate is a measure of the number of customers who have made a repeat purchase with you within a given time range. Since your most loyal customers buy from you the most, this metric identifies the percentage of your customers that drive a major portion of your business.
How to calculate Loyal Customer Rate?
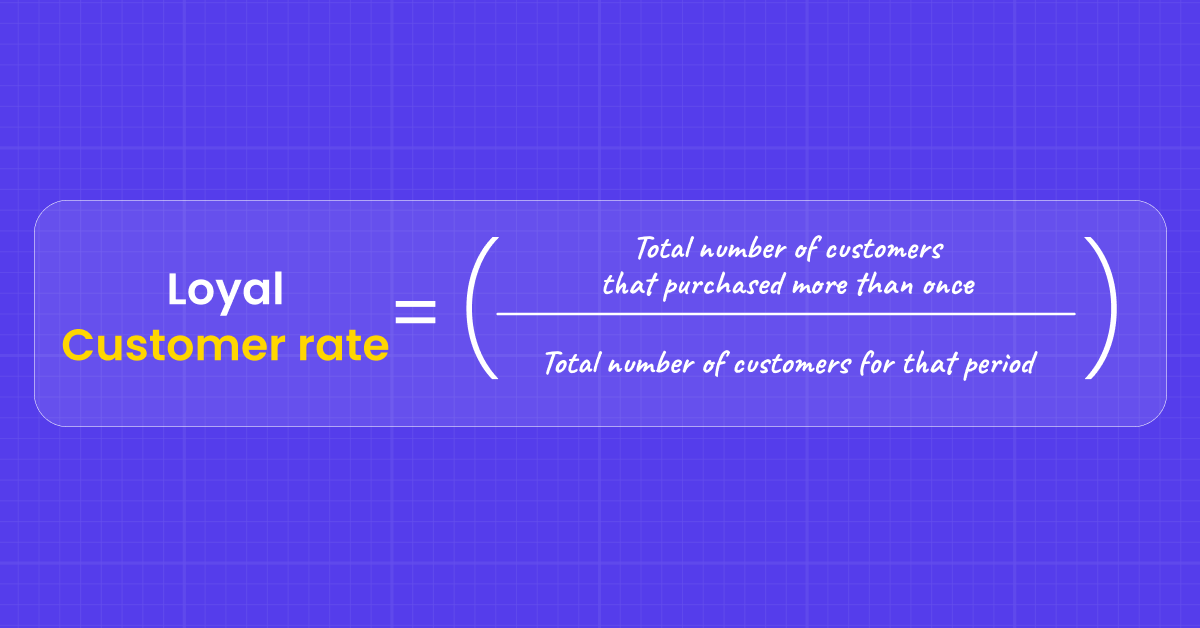
It’s important to know how many loyal customers you have and what portion of your revenue are these customers driving. They not only drive the most sales, but they’re also the most likely to share positive word-of-mouth about your business. It is easier to service these customers as they do not expect the moon from your business and the cost of retaining these customers is close to nothing. By knowing who these loyal customers are, you can also capitalize on opportunities to gather testimonials and encourage customer advocacy.
Example:
Similar to the repeat purchase rate, the loyal customer rate is also calculated based on the number of customers that purchase your products more than once. However, the difference is the time-frame, which is usually longer than the time-frame used to calculate the RPR. So, if your calculated RPR for Q1 of 2022, your loyal customer rate would be calculated for the entirety of FY 22-23.
So, if you had 10mn customers for FY 22-23 and 3.8mn customers purchased more than once, your Loyal customer rate is 3.8mn/10mn = 0.38 or 38%
Easily calculate your most important metrics using our ready-to-use calculator.
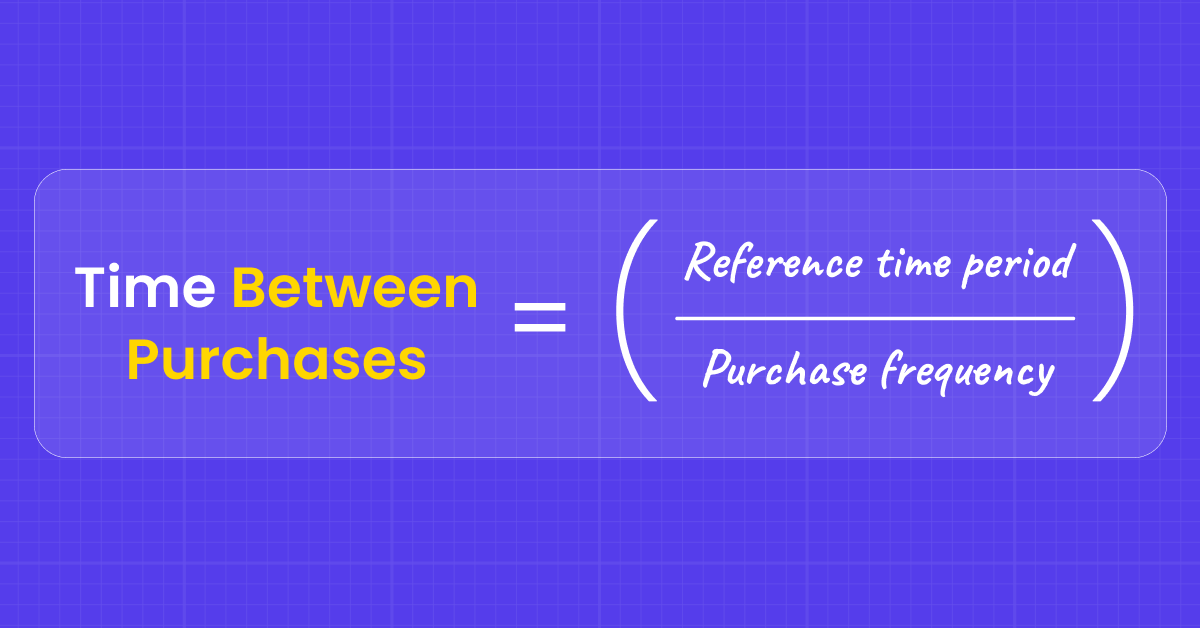
9. Time Between Purchases
As the name suggests, Time Between Purchases lets you understand the average time it takes for an average consumer before they shop with you again. This is an indicator of the propensity of a customer to become loyal to your brand.
How to calculate Time Between Purchases?
First, segregate the pool of customers into one-time and repeat purchase customers. Second, specify the frame of reference to segregation. This is usually a larger time frame depending on the industry/category your business falls in. A common best practice is to consider a time-frame of 365 days.
When tracking this metric, it’s important to compare it to other metrics like customer satisfaction and NPS. It is also pivotal to benchmark these scores with industry trends. This is a clear indication of how your competitors are performing as compared to you.
Example:
If the purchase frequency of your product amongst your customers is 4 times a year, your TBP = 365/4 = 91.25 days
If you’re noticing a higher time between purchases as compared to the industry standards, that may indicate that your product or service isn’t differentiating itself from others in the industry. Or, it could mean that your product is sturdy with a strong built-quality, and customers don’t need to buy it again. Comparing time between purchases with other customer satisfaction metrics is a great way to identify the overall strengths and weaknesses of your product and services.
10. Customer Growth Rate
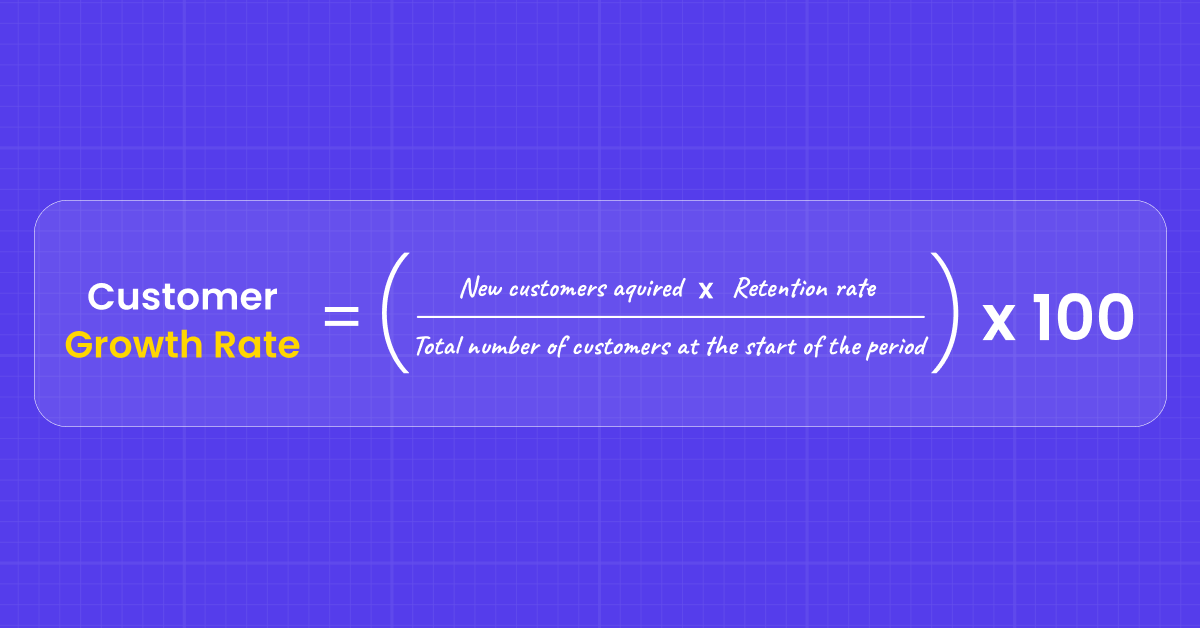
Customer growth rate by definition is the rate at which your customer base grows over a specific period (weeks, months, quarters, years, and so on.) CGR reflects how well you are doing as a business and if your offerings are in-line with the increasing market demands.
How to calculate Customer Growth Rate?
The rate at which the customer base grows is not just a function of acquisition but also depends on how well the business can retain existing customers.
Example:
Let’s take business X as an example. In 2021, the customer base of business X was 5000 customers. In 2022 they were able to acquire 500 new customers with a retention rate of 60%.
The customer growth rate for business X is (500 * 0.6) * 100/5000 = 6%
Your customer growth rate is an important metric for allocating your resources in the future. If your customer base grows faster than you can handle, you may find yourself short on resources to service the new customers you currently have on board. If it grows too slowly, your business may not be able to cope up with the ever-growing business expenses.
11. Product Return Rate
The product return rate is a very important metric for e-commerce and D2C businesses. Product Return Rate as the name suggests is the percentage of products that are returned by the customers during the trial period/return period. This can happen for one of the 2 reasons: The product quality does not meet the expectations of your customers, or, there is a communication gap between what was advertised and what was delivered. The latter is a classic case of the ‘Communication Gap’ in the ‘SERVQUAL Model’.
How to calculate Product Return Rate?
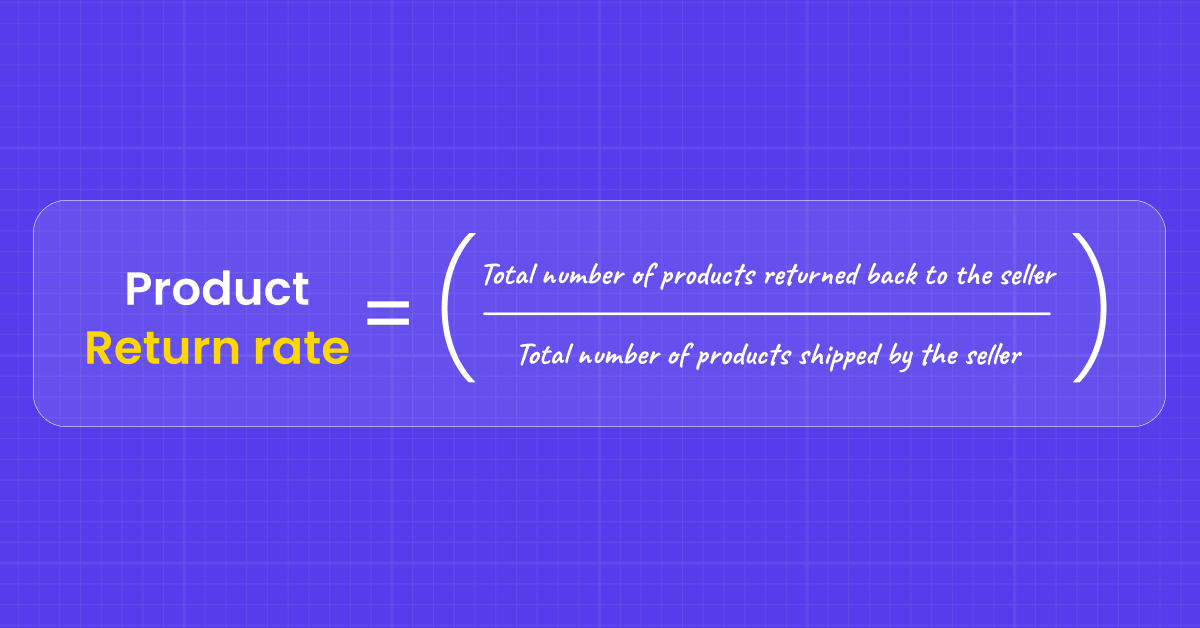
The total number of products shipped by the seller and the total number of products returned, both also account for the number of products lost/damaged/unclaimed in transit.
Example:
For an E-commerce business with multiple sellers, business X is registered on the platform as a seller. During Q2 of 2022, Business X received orders for 20,000 units of which it was only able to honor 15,000 units. Out of these 15,000 units, 100 were damaged during transit and were immediately returned by the customer upon arrival. 10 were lost during transit, and 20 were returned due to the unavailability of the customer (no-claim). You provided your customers with a 7-day ‘no questions asked’ return policy and 900 units were returned by customers.
Product Return Rate = (100+10+20+900)/15000 = 6.87%
For aggregators of digital marketplaces, it is imperative to attach Product Return Rate as a ranking measure for various sellers on the platform. If the PRR is high for a seller, you may want to showcase their products on a lower frequency as opposed to other sellers with a higher PRR. PRR can be directly correlated with the Net Promoter Score of a business. A majority of the detractors come from the customers who have returned their products. PRR is a great indicator of the loyalty index of businesses.
12. Days Sales Outstanding
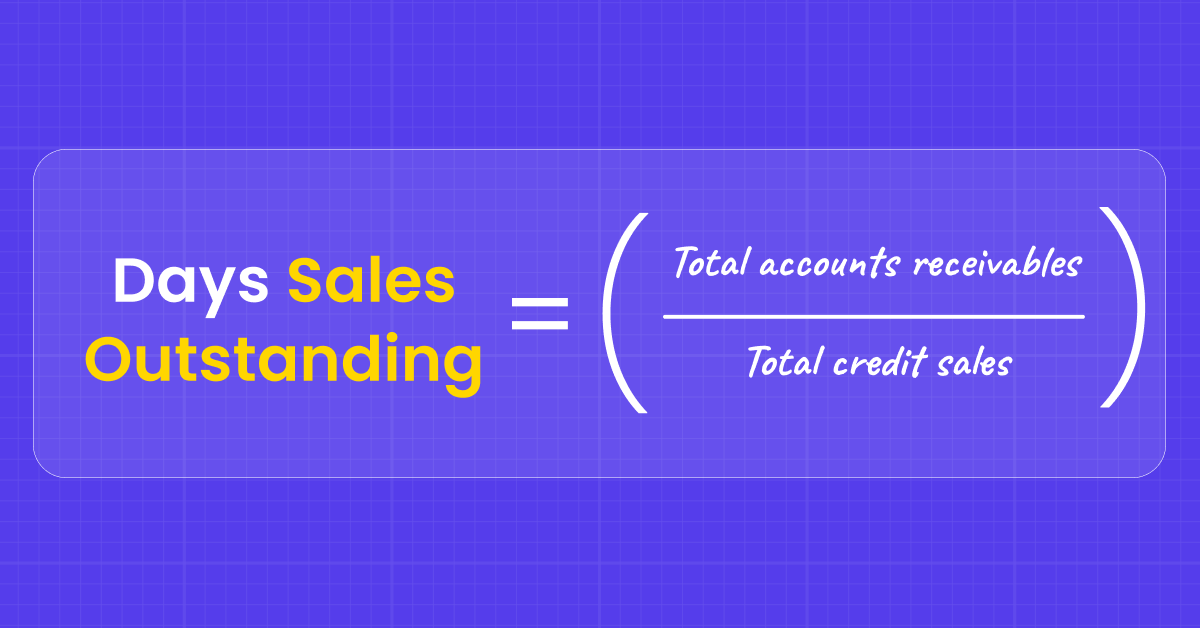
Days Sales Outstanding is a financial ratio that measures the average collection period after-sales. It ascertains the number of days the receivables lie outstanding. If your business has a 45-60-90 day credit policy, the frame of reference can be chosen accordingly. Days Sales Outstanding shows how quickly a company can convert its credit sales into liquid cash.
How to calculate Days Sales Outstanding?
It is generally calculated on a monthly, quarterly, or annual basis. The most preferable time-frame is 3-months (90-days)
Example:
Say your business in the past 90 days, has done a credit sale of $100k. Also, during the same period, you were able to recover $30K. This leaves your net receivables at $70k. So your DSO = (70,000/100,000)*90 = 63 days.
A higher DSO is unfavorable for the business and a lower DSO is beneficial for the business. However, this does not always hold true. It depends on the company policies and your relationship with your buyers. While a Higher DSO may not be favorable for the company’s balance sheet, it may be beneficial in building a lasting and stronger loyalty amongst your buyers. On the other hand, a smaller DSO may be beneficial for your balance sheet but may result in a higher customer churn rate and loss of revenue.
13. Share of Wallet (SOW)
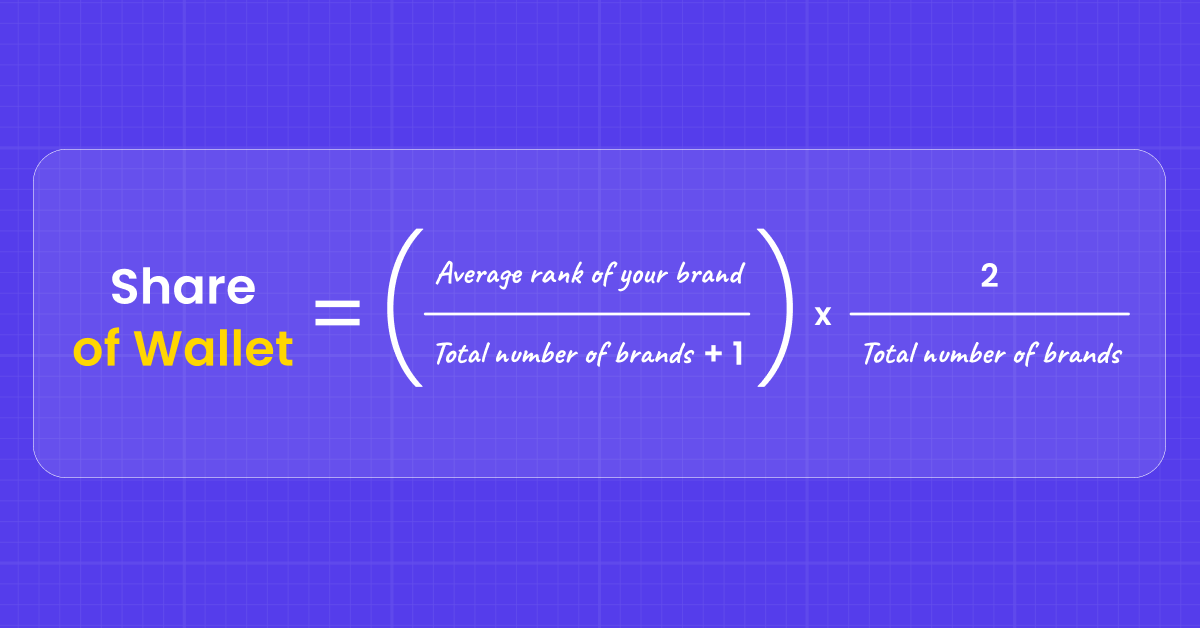
Share of wallet (SOW) is the dollar amount an average customer shares with a particular brand rather than with competing brands in the same product category. Companies try to maximize an existing customer’s share of wallet by introducing multiple products and services to generate as much revenue as possible from each customer through upselling and cross-selling. A marketing automation campaign, for example, may have a stated goal of increasing the brand’s wallet share for specific customers at the expense of its competitors.
How to calculate Share of Wallet (SOW)?
The method of calculating the wallet share is slightly complex.
Step 1 – Make a list of all the competitors in a particular product category.
Step 2 – Ask your customers to rank you and all the other brands on a scale of preference. 1 being the highest.
Step 3 – Use the formula for calculating your SOW:
Example:
If customer A wishes to spend $200 a month for dining-out (hypothetically), and he has 5 options to choose from, you will first ask him to rate the brands in order of his/her preference (1 being the highest and 5 being the lowest). Say you get a rank 2.
So, SOW=(1-2/6)*2/5=26.8%
This means that Customer A is likely to share 26.8% of his budget i.e. $53.6 with your restaurant.
14. Customer Satisfaction (CSat)
CSat (short for Customer Satisfaction) is ideally a similar metric to NPS tracked by business owners and marketers. While NPS signifies the loyalty quotient of a customer with the brand, CSat helps in gauging how satisfied a customer is with the product/services.
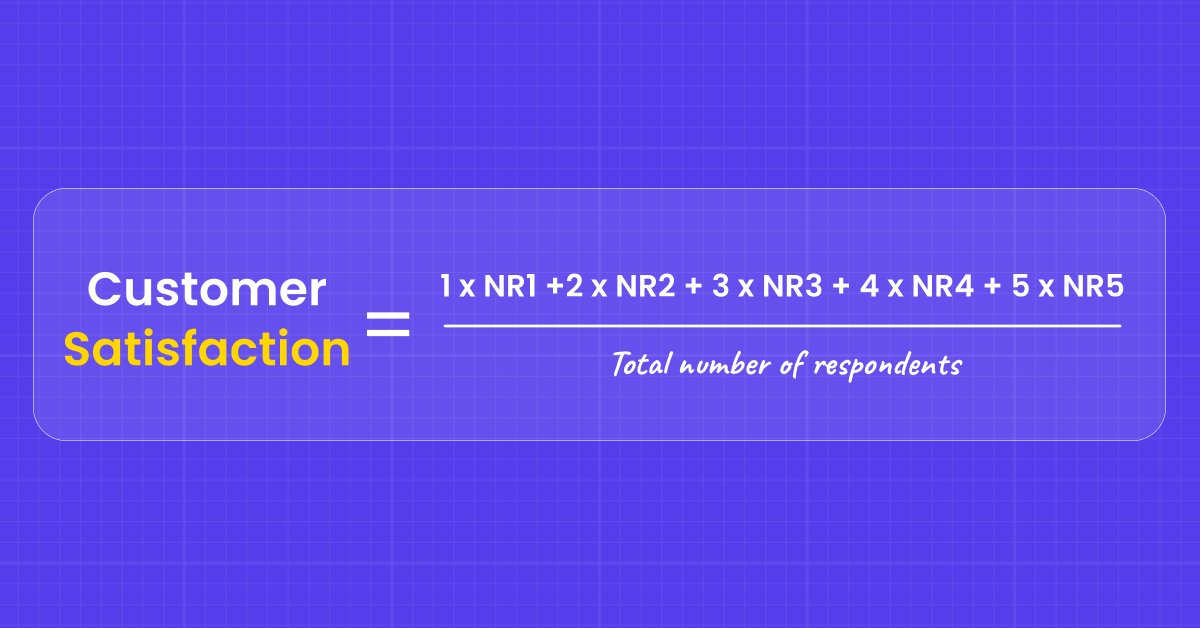
How to calculate Customer Satisfaction Score (CSAT)?
CSAT is captured using the same feedback channel as NPS, but this time the customer is asked for his/her satisfaction on a particular product/service on a 5-point scale.
Q. How satisfied are you with the current transaction?
1- Highly Unsatisfied
2- Somewhat Unsatisfied
3- Neutral
4- Somewhat Satisfied
5- Highly Satisfied
Based on the ratings captured from multiple customers, an average score is calculated to give business owners a sense of what are the immediate improvements/action items to retain customers.
Example:
After capturing responses from 100 customers, your score distribution is as follows:
1- 20 respondents (NR1)
2- 5 respondents (NR2)
3- 40 respondents (NR3)
4- 20 respondents (NR4)
5- 15 respondents (NR5)
Therefore, your CSAT score is = (1*20+2*5+3*40+4*20+5*15)/100 = 3.05
Your aim should be to increase this number and try to achieve a perfect 5. CSat should not be benchmarked against an industry average as achieving a perfect 5 should be the aim of every business.
15. Customer Retention Cost
Simply put, customer retention cost (CRC) is a sum of all the costs incurred in retaining an existing customer. These include all direct, indirect, and support resources utilized behind making sure an existing customer purchases again.
How to calculate Customer Retention Cost?
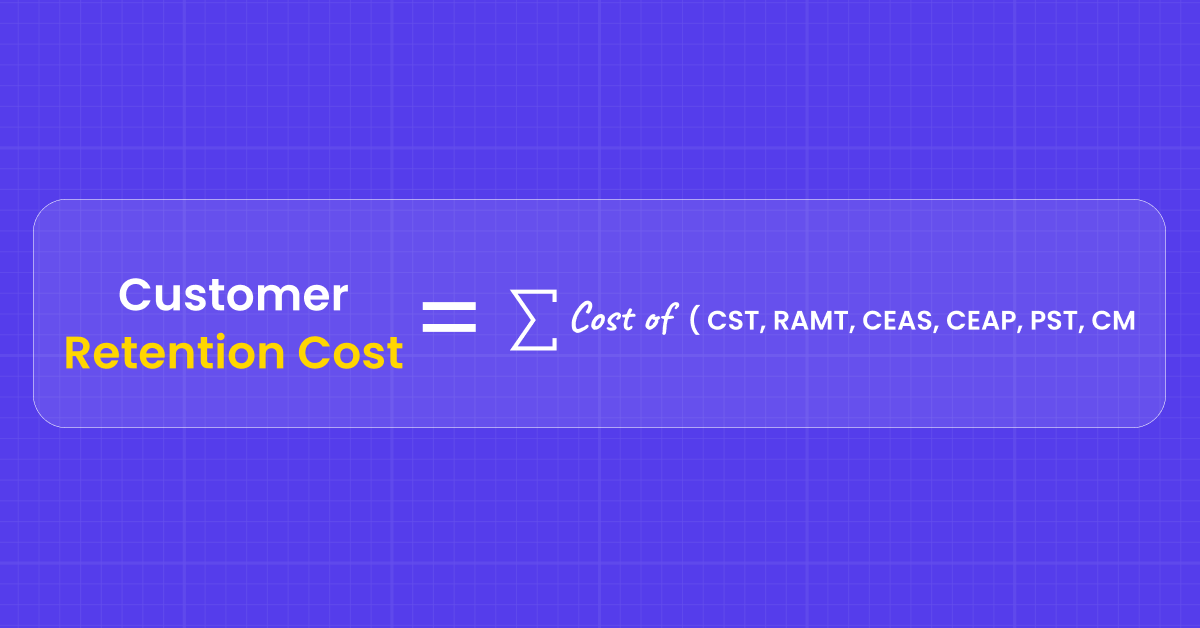
Where CST = Customer Success Teams,
RAMT = Renewals and Account Management Teams
CEAS = Customer Engagement & Adoption Systems
CEAP = Customer Engagement & Adoption Programs
PST = Professional Services & Training
CM = Customer Marketing or Retention Marketing Activities
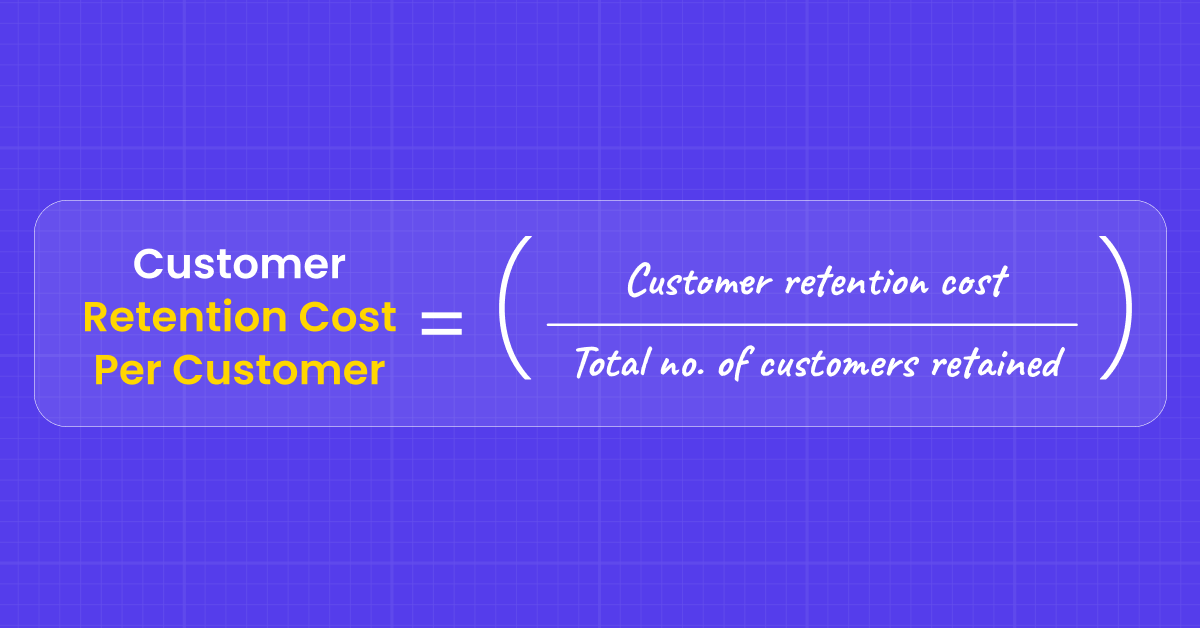
Now that we have an overall view of the customer retention budgets, we now move to find out the Customer Retention Cost per Customer (CRCC)
Example:
If business X has spent $1mn behind retaining customers and is able to retain 20,000 customers in a given period, customer retention cost per customer (CRCC) = $1mn/20,000 = $50 per customer.
Hence, it becomes imperative for brands to optimize the CRC to get lower CRCCs. Lower CRCC means easier to retain customers, this implies higher retention rates which leads to profitable businesses.
16. Customer Acquisition Cost
As the name suggests, CAC is the expense that a business incurs behind acquiring a new customer. The process of calculating the CAC is fairly complex and is usually done on an annual basis. However, if you may, this can also be done quarterly. This is a joint metric owned by both Sales and Marketing functions and it is the responsibility of both teams to optimize CAC to increase the profitability of an organization.
How to calculate Customer Acquisition Cost (CAC)?
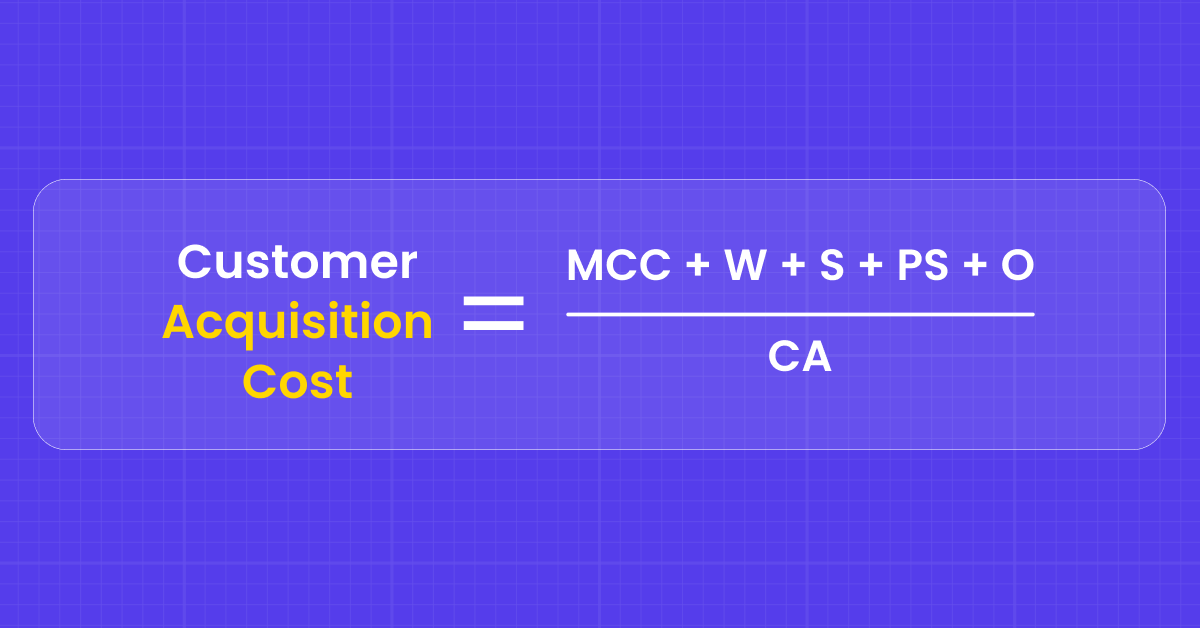
Where MCC = total marketing cost for acquiring new customers
W = Wages connected with Sales and Marketing
S = Costs associated with Marketing & Sales Software (CRM, E-Commerce Platforms, Automation Software, A/B testing platforms, etc.)
PS = Additional professional services required by marketing & sales functions for acquiring new customers
O = Other overheads between marketing and sales
CA = Total number of new customers acquired.
Example:
Assume a fairly small B2B organization. Here is a breakup of the Marketing & Sales expenses:
Marketing expenditure towards paid advertising, content creation, and other channel management- $100 per customer for 1000 customers.
Wages associated with the sales and marketing team – $300k
Cost of additional software required – $75k
External agencies and professional services – $30K
Other overheads – $50k
Effectively the customer acquisition cost is (100k+300k+75k+30k+50k)/1000 = $555 per customer.
Customer acquisition cost has a direct relation with the Lifetime Value of the customers. The LTV to CAC ratio indicates the health of a business model and is a direct notifier for potential investors if the business model is sustainable or not. If LTV : CAC is –
1:1 – The company loses money with every acquisition. The business may face financial difficulties sometime in the future, not immediately.
Less than 1 – The company is paying more to acquire customers than what they are worth. The company is practically paying money for customers to use their products and services and is nowhere close to being profitable
3:1 – This is the ideal benchmark where every business should revolve around. This shows that your business is making enough revenue to sustain the current acquisition model and remain profitable.
Greater than 3 – The business has untapped potential and has massive scope for acquiring new customers.
We’ve also converted these into a downloadable calculator for you!
3 Tips To Improve Customer Retention Rates:
By now, we know why retaining customers is the best and most cost-efficient way of growing your business and being profitable. Here are 3 tips before you begin your customer retention journey:
1. Keep tabs on your churn metrics
Keep a constant check on the early signs of customer churn through the metrics mentioned above. Regularly follow the ones that are relevant to your business. Add ones that are key to your business and are not listed above.
Remember, improvement is a gradual and constantly evolving process. Hacks can give you momentary spikes in your metrics, but sustained growth comes with time.
2. Hyper-personalize your communication
The more you know about your customers, the more you can tailor your communication with them. WebEngage gives you a consolidated view of the customer’s life cycle so that you can determine what kind of offer will be the most appealing to each individual and increase relevance, which will keep your brand on top of your customers’ minds. You can re-target your inactive (dormant)customers with Email campaigns, social media adverts, and stand-out WhatsApp and SMS communications.
What you need right now is to identify ways to revive their interest and convert it into an actual purchase! You can do it by offering them special discounts or some additional value for your product. Send them a special offer deal or a discount on a new product and make them feel that you care and haven’t forgotten about them.
3. Gather customer feedback
Understanding your customers’ needs and pain points is essential for improving retention. Regularly gather feedback through surveys, interviews, and customer support interactions. This feedback will help you identify areas where you can improve your product, service, or customer experience.
Here are some specific tips for gathering customer feedback:
- Send out regular surveys: Use surveys to track customer satisfaction, identify areas for improvement, and measure the effectiveness of your retention efforts.
- Conduct customer interviews: One-on-one interviews can provide deeper insights into customer needs and motivations.
- Analyze customer support interactions: Pay attention to the common issues and complaints that customers raise through your support channels.
4. Reward your VIP Customers
Remember Pareto’s principle? In the context of stakeholder relations, it is believed that 80% of your revenue comes from 20% of your customers. These 20% are your VIP customers. They are loyal to your brand, spread positive word-of-mouth, and are the first ones to support you with anything new you do with your business model. Reward these customers for their loyalty. Don’t wait for your customers to go silent before you try retaining them. Just surprise them with a discount code, give them a social media spotlight, or even send them a personalized letter with their next purchase. A small gesture can leave a lasting impact on a customer.
Final thoughts:
It’s imperative that your company allocates time and resources to customer retention. If putting together a comprehensive customer retention plan currently feels difficult, then start small. Begin with one metric at a time. You’ll soon realize that focusing on one north-star metric will snow-ball into every other metric taking course. Begin by tracking a few metrics mentioned here you’ll be headed in the right direction.
Want to experience the power of a full-stack Retention OS? WebEngage empowers thousands of brands globally to retain their customers through a simple, easy-to-use platform that our customers absolutely love! Want to check us out? Schedule your session today!
FAQ
What is a good customer retention rate?
A good customer retention rate varies depending on the industry, but generally, a rate of around 85-95% is considered excellent for most sectors. However, for industries with higher competition or more frequent purchase cycles, like retail or fast-moving consumer goods (FMCG), a slightly lower rate might still be very effective. It’s important to compare your retention rate with industry benchmarks to accurately assess its effectiveness.
What is customer retention?
Customer retention refers to a business’s ability to keep its customers over time. It is a measure of how well a company can maintain a long-term relationship with its customers, encouraging them to continue using its products or services. It is considered a key indicator of customer satisfaction and brand loyalty.
Why is customer retention needed?
Customer retention is needed because it leads to customer loyalty, repeat purchases, and can significantly contribute to the overall profitability of a business.
Is customer retention a strategy?
Yes, customer retention is a strategy that focuses on keeping existing customers engaged and satisfied with a company’s products or services. This strategic approach involves various tactics and practices aimed at enhancing customer loyalty, increasing customer satisfaction, and encouraging repeat business.
PS: If you find this article helpful, do let me know at chirag.parmar@webengage.com. Would love to know your thoughts!
We’ve also converted these into a downloadable calculator for you!


 Vanhishikha Bhargava
 Harshita Lal
 Priyam Jha
 Inioluwa Ademuwagun