


India’s homegrown payment apps have reshaped the mindset of consumers so drastically that even for the smallest of transactions, a payment app is used. From your daily dose of chai to a lip-smacking plate of dumplings, India has gone digital.
The value of instant digital transactions in India last year was far more than in the United States, Britain, Germany, and France.
Where does this growth come from?
Aside from creating the right product at the right time, there’s due credit to product teams for understanding the customer like the back of their hands. Going through the payment journey fiercely, understanding how the customer will perform the act, and identifying channels to bring that back – everything was found using user funnels.
On average, 70-95% of revenue comes from upsells and renewals. Can funnels help you identify these low-hanging fruits for your business? Let’s find out.
What are funnels?
A marketing funnel depicts the user’s journey using metrics such as user path, interactions, and drop-off, among others. It can be a single step or a combination of multiple user interactions before reaching the end goal. Whether digital or physical, a funnel can help teams understand the user journey in depth and build on it.
BONUS READ: Ten Powerful Ways To Boost Fintech User Engagement Through Funnel Analysis
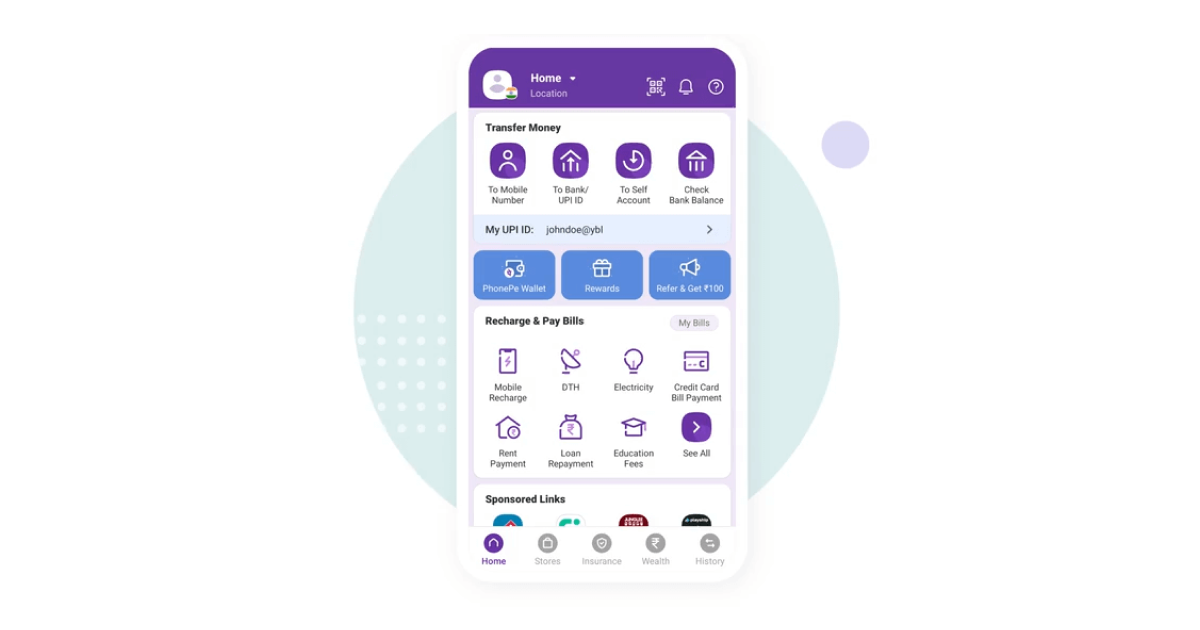
The key to funnels is not building them but reading them. As a growth marketer, identifying the leaks in your funnel, picking the problem areas, and working on them for better product consumption is the real deal. For example, a growing payment services brand like PhonePe would have a funnel that tells them:
- Where are the users being acquired from?
- What function or at what step are they activating?
- How are these users converting (sending their first payment)?
- How do the new users compare to the retained ones?
- Is the referral funnel strongly built?
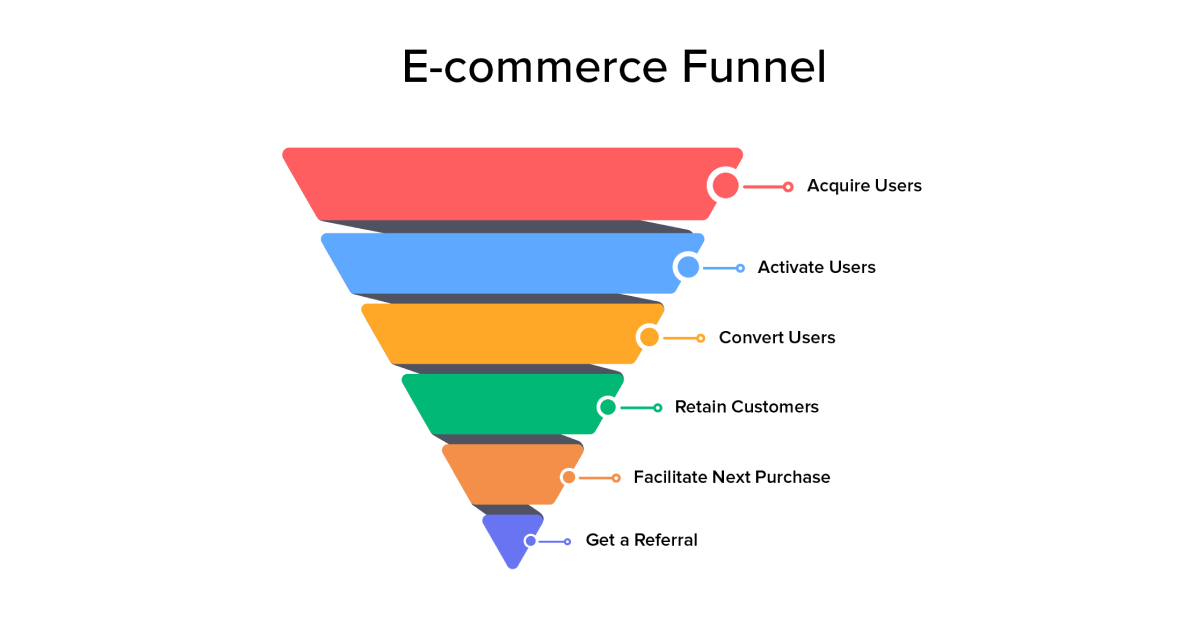
Collectively, all of these stages bring a solid user base inward for the organization and also focus on sustaining acquired users. Aside from this, these funnels are divided into the following stages for teams to better focus on users’ behavior.
- Acquisition: to bring in more prospects
- Activation: to convert a large number of prospects into customers
- Monetization: to push users into making their first purchase
Now that we have understood what funnels are let’s understand how you can get started with it. Each step of your funnel needs to be thoughtfully curated as an event done by your users to reach the end goal. For example, a payment gateway such as PhonePe wants users to make at least one transaction in a week. So the funnel for this would look like: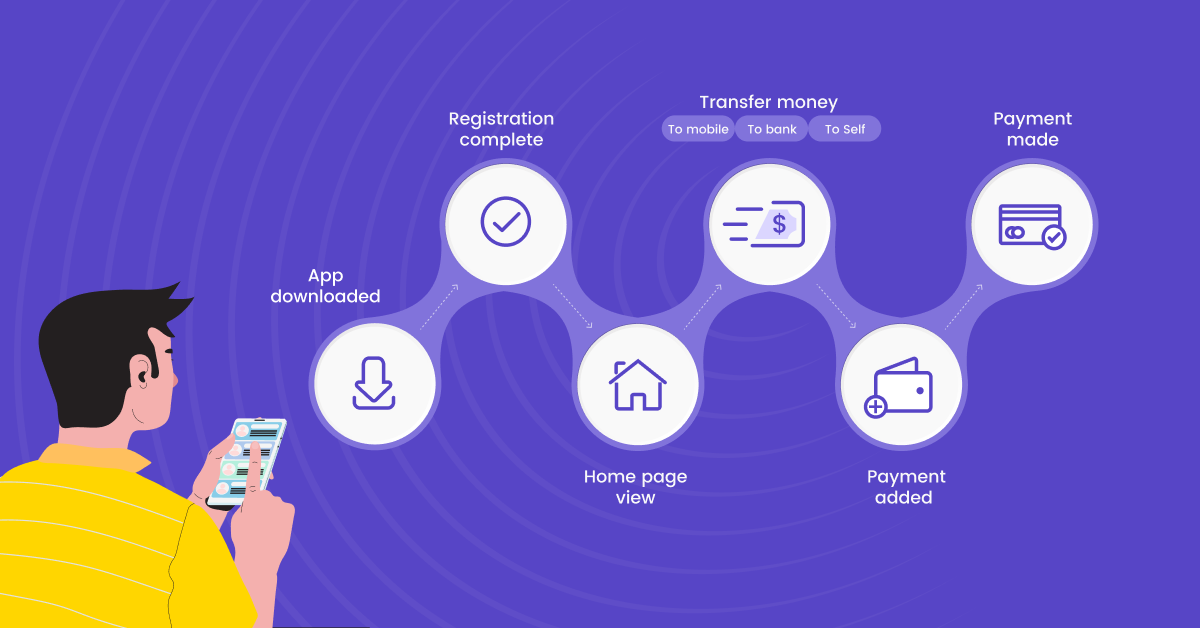
Each step will be an event that can be captured by the product/growth teams to track the leakage in the funnel or conversion per stage. This means that if users click on ‘transfer money’ and do not reach the ‘payment made’ stage, there’s a drop in stages 4 & 5, which needs to be resolved.
Analyzing funnels
Before we move to the final segment of this article, which is doing a funnel analysis for business insights and decisions, let’s spend a few minutes on how to analyze these funnels. Once a funnel is created, the job of a marketer is to study user behavior in depth.
You have to start by selecting a period for which you want to make the analysis. Then, slowly move to the events ‘core actions’ and learn their progression – which means the number of people who entered vs. the number of people who exited. Dig deeper into who these users are, why they left, how long they stayed, etc.
Teams can measure this over days, time slots, regions, events, etc. So here’s a checklist for you to drive actionable insights from your funnel analysis:
- Define your funnels: Have a clear goal for your funnel, and only then will you have the clear events and steps to incorporate.
- Track users: Work with tools like Google Analytics or other funnel analytics software such as WebEngage to monitor user interactions at each stage of the funnel. This will help you collect data on user behavior and identify drop-off points.
- Set your KPIs: Common KPIs include conversion rate, bounce rate, average time on page, exit rate, etc. These metrics help you conclude faster.
- Visualize your funnel: Visualizations provide a clear overview of user progression through each stage and highlight areas for improvement.
- Identify leakage: Where are your users dropping off at higher rates? These drop-off points indicate potential issues that need to be addressed to optimize the funnel.
- A/B Testing: We strongly feel A/B testing is the path to success. Once you gather insight, run your tests through copy, CTA, page layouts, etc. A/B testing helps you make data-driven decisions to improve conversions.
- Heatmaps & your users: Not many brands use heatmaps to follow their users into – where they click the most, where they spend the most time on their product, or even utilize heatmaps to gain insights into how users interact. The insight into areas of high and low engagement is gold.
- Segmentation: While analyzing, segment your funnel data based on different user demographics, traffic sources, or device types. This allows you to understand how various user groups interact with the funnel differently and tailor your optimization strategies accordingly.
- Path analysis: Analyze the flow of users through your funnel to understand the typical paths they take. This analysis can reveal patterns and areas where users might be getting stuck or taking unexpected routes.
Using funnel analysis for insights
Find the traffic sources.
Funnels are a great way to identify high-traffic areas and what to do with them. Use the analysis to visualize the app’s traffic influx and drop-off rate or conversion rate. The core purpose is to help you understand when and where visitors are leaving.
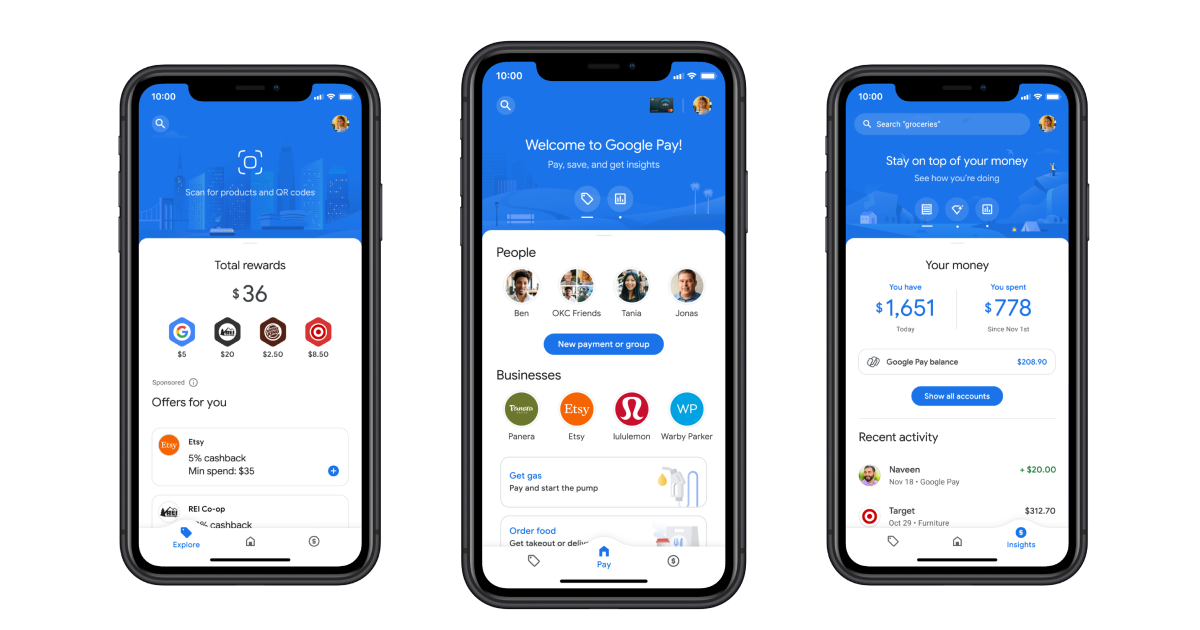
For example, here’s a screen grab from GooglePay. The app has 67 million active users in India; however, if only 3% of users pass through the funnel, there’s some leakage in the flow that’s keeping users from going through.
- It could be a lack of clarity on the next steps
- It could be poor UI/UX
- No user onboarding, etc.
What funnels do is allow a sneak peek into where this drop is happening so product/growth teams can fix this for their users.
Identify the source of high-quality users
Aside from finding issues in the flow, funnels are also a great way to spot pockets of success that can bring engagement or revenue. For instance, at any given point, core users who perform a defined action are far more important than just regular DAUs. To build a stronger brand, product teams should focus on users who are performing a core action, engaging with the brand, and having their problems solved.
Funnels are a gateway to this information. A funnel can tell you that users from affiliate channels are more active, possess in-depth product penetration, and have a stronger affinity to buy than those from social media.
In the below image, the funnel is being analyzed over time, week, duration, UTM, technology, screen, etc.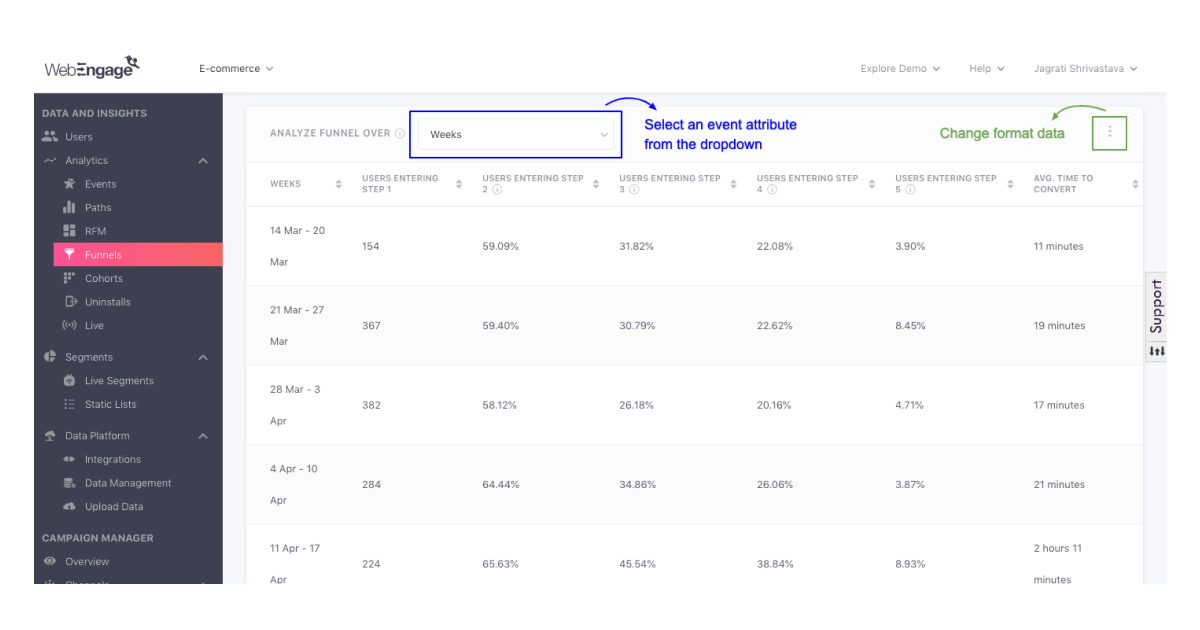
In such a case, product and growth teams can double tap on their efforts on these levers and bring in more value to the business. In the above image, the funnel is being observed by the ‘weeks’ filter, where users’ step is their natural navigation in the system.
Understand individual user journeys.
In the default view, unlock this section by choosing ‘Funnel’ from the list of funnels. This is what you will see when you land on the page, and the data here has been structured to offer a comprehensive breakdown of the funnel’s performance.
In the below image, the time range is from the last month, encompassing metrics such as the total conversion rate, average user exit time, conversion rates between each step, and weekly distribution of user entries and step completions within the funnel.
Why do growth teams love this view? Because even with little to no knowledge of how to create funnels, the portal creates this view for you, allowing you to experiment with the data and build possibilities for improvisation.
In the below image, the default view allows you to view your funnels at a comprehensive level, overseeing the performance of past month. The metrics which are being analyzed can be handpicked by the team.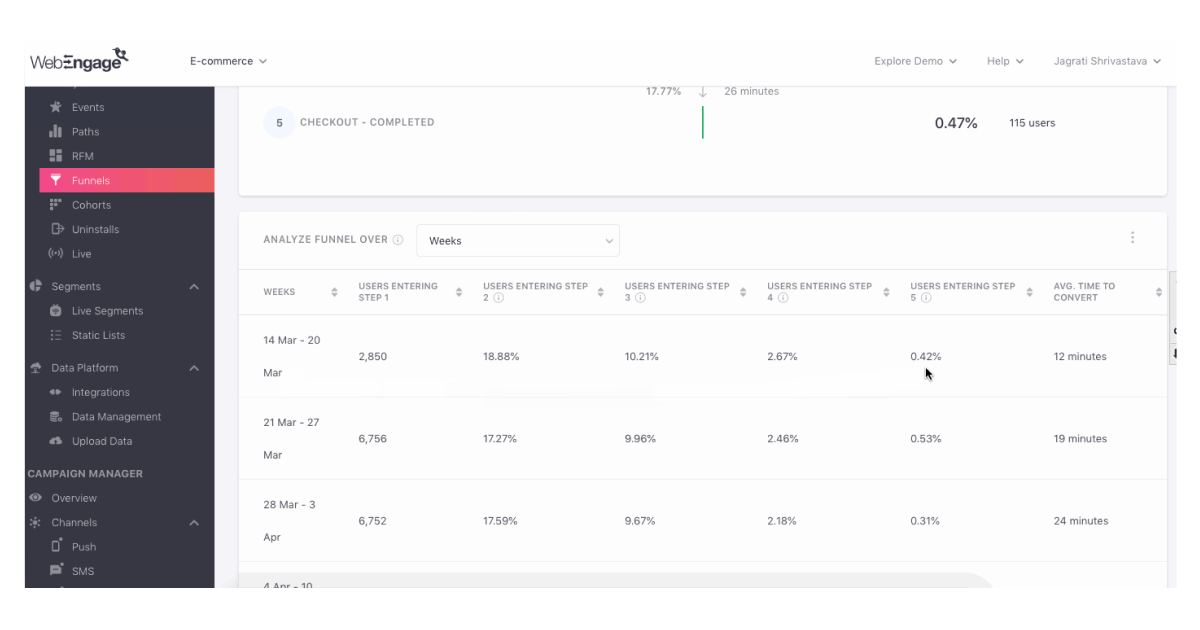
Understand data over a stipulated window.
Using a funnel analysis to understand your user’s behavior over a period, such as days of the week, month-on-month, quarters, etc., can provide deep insights into customer activities. The selected range informs growth teams about the user’s activities in that window.
For example, you’ve launched a new feature that’s aimed at helping users identify coupon codes while making a payment through the app. Now as a growth team, studying the impact of that feature release from the date of launch could help you understand things like:
- How many users discovered the code vs. those who made the payments?
- How many users used it?
- Did it help in increasing overall app engagement and active time?
- Did it increase the ticket size of the transaction?
- Was this helpful in resurrecting users?
These questions are seminal to product growth in learning the wants and needs of your users.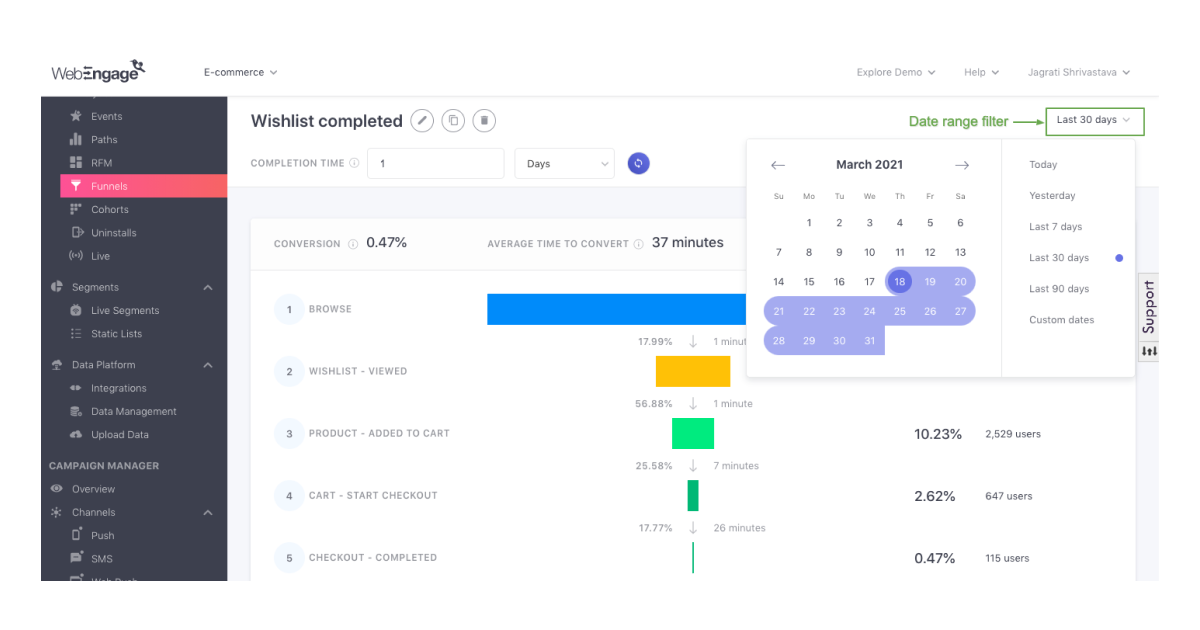
BONUS READ: Top 6 B2C Marketing Funnels To Track For Improved Conversions
Make a solid conversion analysis.
Funnel analysis, they’re all about driving conversions. Using conversion analysis is a powerful method to understand how users progress through various stages of a process and where they might drop off.
Let’s take the below funnel as an example. If it were Excel, it would look like this – data divided over rows and columns in a non-engaging way. However, a funnel on a dashboard like WebEngage can play with in terms of conversion, time, channels, stages, and growth teams can pull critical conversion data and improvise.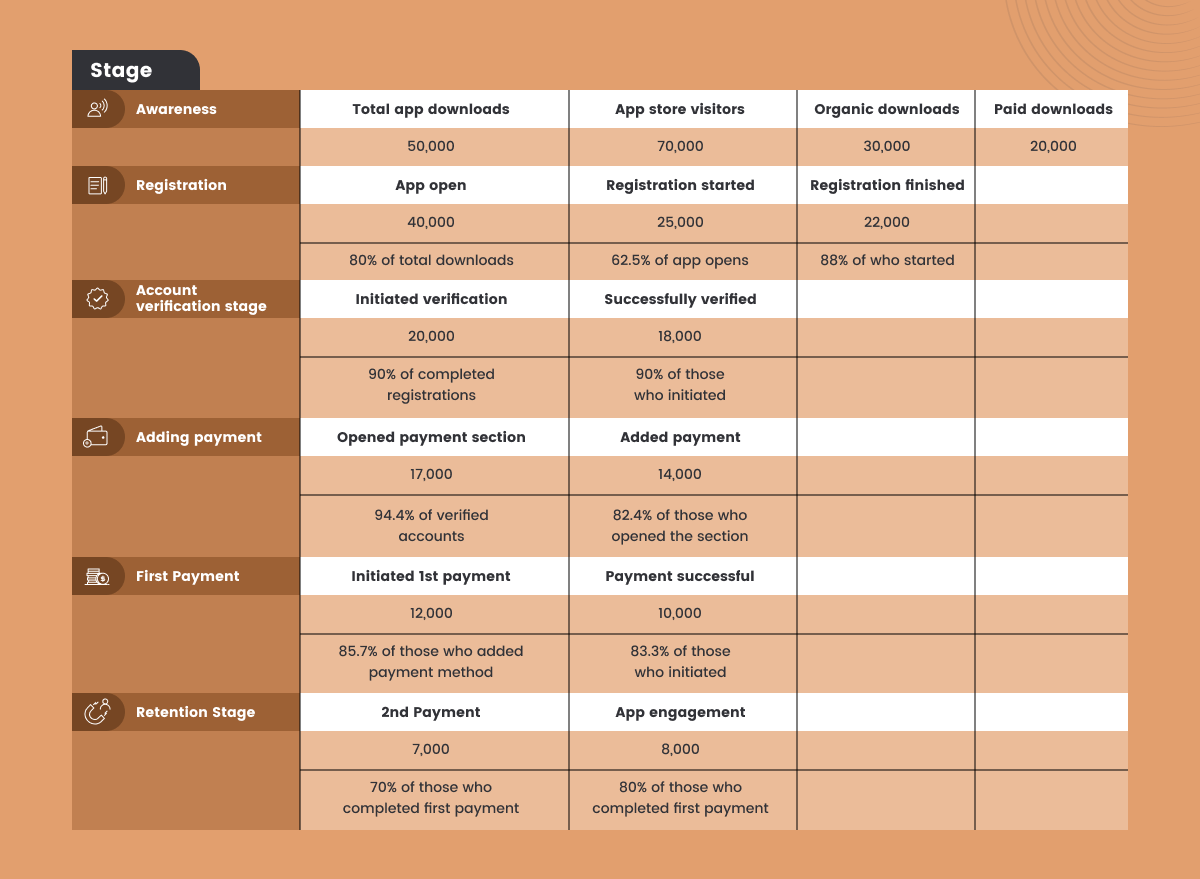
For instance, in this funnel, the awareness stage has been decently effective with 60% organic downloads. This indicates a healthy split of intent-based users versus those who have been pulled in. Similarly, registration has a high completion rate, indicating a relatively user-friendly process.
A slight drop in account verification suggests that some users might be facing challenges during this step. This is where teams need to jump in and dissect the cause and matter. The drop between initiating and completing the first payment suggests a potential need for clearer instructions or incentives to encourage completion.
Retention rates are relatively positive, with a significant portion of users making a second payment and engaging with app features.
Study what’s happening on your high-impact pages.
Probably from the ingress point (like your home page from where the user enters) to the exit point (checkout, payment page, etc.), a great deal of insights are hidden. Studying these high-impact exit pages can open up an avenue of key insights for growth teams to get closer to the user’s problems.
As discussed in the previous example, doing a funnel analysis will also help you learn why your users are leaving a page – what triggers the behavior? If you can solve it, then you can relatively increase the engagement and, subsequently, the revenue.
Moreover, doing a funnel analysis also helps you narrow down high-challenge areas on important exit pages, such as broken links causing user drop-off.
Bullet-proof decision-making
Funnels offer acute visual clarity on the user journey. This helps team members and stakeholders quickly understand the progression of users through different stages of a process. Given it’s all about the data, funnels make decisions more objective and evidence-based.
Team members and stakeholders can trust that decisions are grounded in real user behavior. Funnels guide decisions by indicating where efforts should be prioritized. If a specific stage has a high drop-off rate, it becomes a prime area for optimization.
Average time to convert
Another great metric that allows a peek into how long it takes for a user to convert. Now here, conversion can mean different things to different teams.
- Is it turning into an active user and performing the core action?
- Is it reaching the checkout page?
- Is it going through their first payment?
Well, you can define your own conversion, but the funnel here lets you see the average time you traveled from point A to the last point defined by you. For instance, the below image shows that the average time taken for a user to exit the funnel (convert/ buy/ make a purchase) is 37 minutes.
As a marketer, you can kick off campaigns for users who take more or less to convert, designed specifically to push them out of the purchase funnel as soon as possible. This will help you understand outliers and laggards, respectively, cloning the winning strategy for the entire base and eradicating the challenges.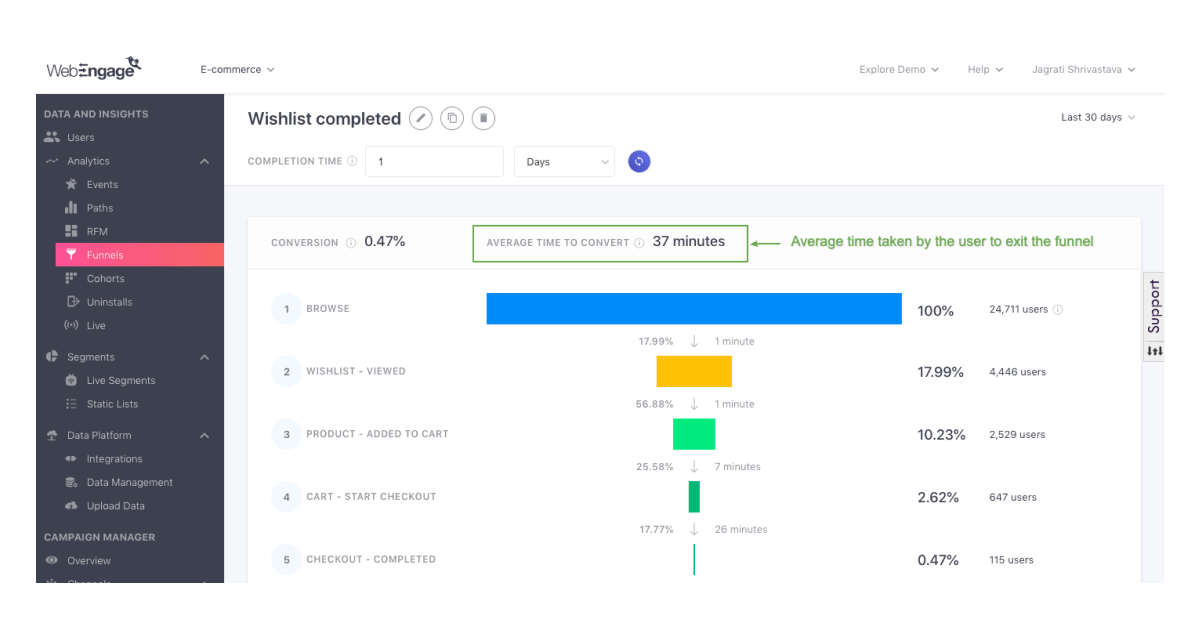
Conclusion: Why is funnel analysis important?
There are countless ways in which doing a funnel analysis can help decipher and deduce data. The way you look at your funnel also depends on what is the burning problem you want to solve – is it new users? Is it registrations? One should work backward from that and focus accordingly.
As a marketing professional, your only task is to make sense of the data and use it to your benefit. Doing a funnel analysis is purely your gateway to insights. We recommend you spend a lot of time on it and play with the fields till you reach a goldmine of insights that help you improvise on your business goals.
At WebEngage, we can help you know your users, cohorts, and segments better so you can work with and around them. Use your funnel analysis to dissect user’s behavior against a variety of parameters and unlock success. Book a demo with our experts if this gets you curious.

 Ajit Singh
 Ananya Nigam
 Prakhya Nair
 Avlesh Singh
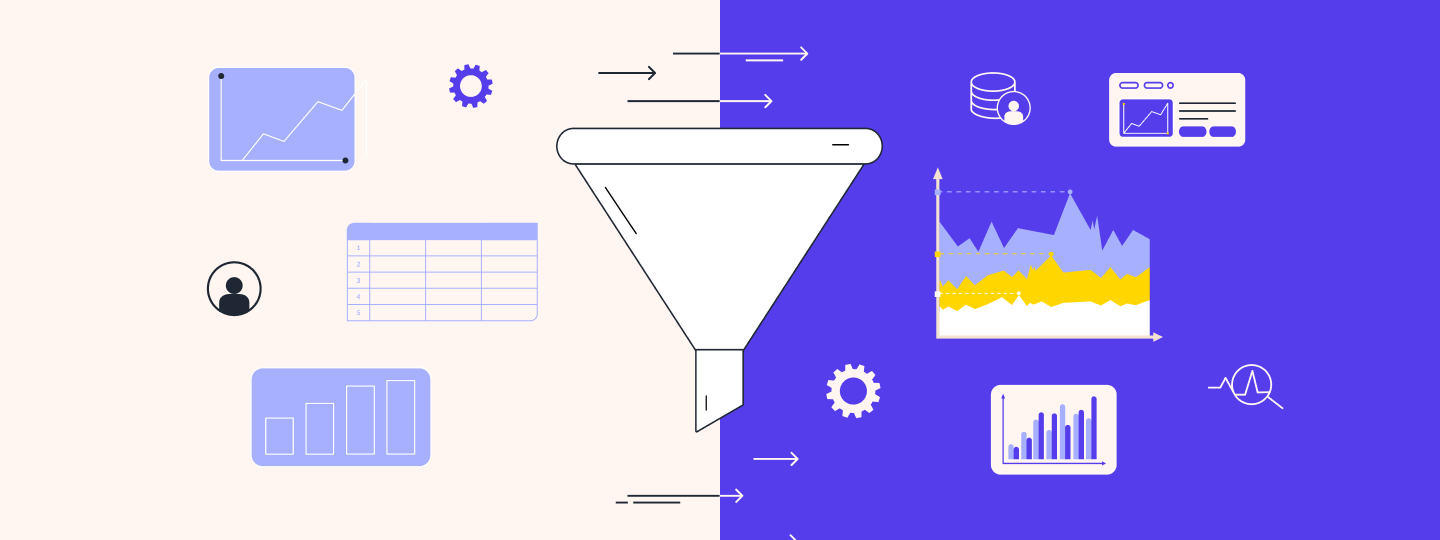
 Harshita Lal