


It’s hard to drive meaningful actions from your marketing campaigns when you’re drowning in a sea of data and multiple reports. Moreover, it’s a tedious and time-consuming process to manually gather data from different sources every time to view and analyze key metrics.
That’s why we are excited to announce the launch of Dashboards to level up your analytics. Dashboards enable you to display, analyze, and track key performance indicators (KPIs), metrics, and data points at a glance. With the new feature, you can create and customize your own analytics dashboard by choosing the metrics that matter most to you.
Each dashboard you create is composed of cards which are widgets that you can pin to the board to track metrics you are most interested in. You can pin cards that track users, events, funnels, segments, and cohorts. Once you initially set up all of your data sources, your dashboard will automatically maintain and generate reports.
Benefits of using Dashboards for your business
-
-
Get quick access to key metrics
-
You can collect and organize all the relevant engagement and retention metrics into a digestible view by bringing them into a single dashboard. And easily compare and monitor critical data points.
-
-
Visualize your data
-
With the help of line graphs, bars, and tables, you can easily identify new trends, patterns, and outliers within your data sets. This will help you make informed decisions and drive important metrics.
-
-
Understand business growth drivers
-
Dashboards offer intuitive and data-rich insights into your whole marketing funnel, showing new opportunities to earn revenue. So not only can you understand the key factors driving ROI, but you can also identify ways to improve it.
-
-
Improve team efficiency and productivity
-
Dashboards allow everyone in the organization to make and validate business decisions and create greater synergy across the organization. With the data readily available on a dashboard, multiple stakeholders can easily access the information they need at any time and share the relevant metrics across different teams to ensure everyone is on the same page.
How to create a Dashboard in WebEngage
Here’s a step-by-step guide on how to create your first Dashboard:
Step 1: From the left navigation menu on the WebEngage dashboard, click ‘Dashboards’. Now, click + icon at the top to create a new board. Name your board, then click Create.
Step 2: Once the empty board is created, you can start pinning your cards by clicking the relevant sections (Eg: Funnels, Cohorts, Events, etc.) in your WebEngage account. That’s it!
Tip: You can perform specific actions like Rename, Resize, Delete, and Rearrange the cards on the dashboard based on your requirements.
WebEngage’s Dashboards come with various features, including cards, dashboard actions, dashboard shareability, screenshot, and more. Learn more about these features here.
Examples of Dashboards across different industries
Here are a few examples of how you can make the most of the Dashboards for your business:
-
-
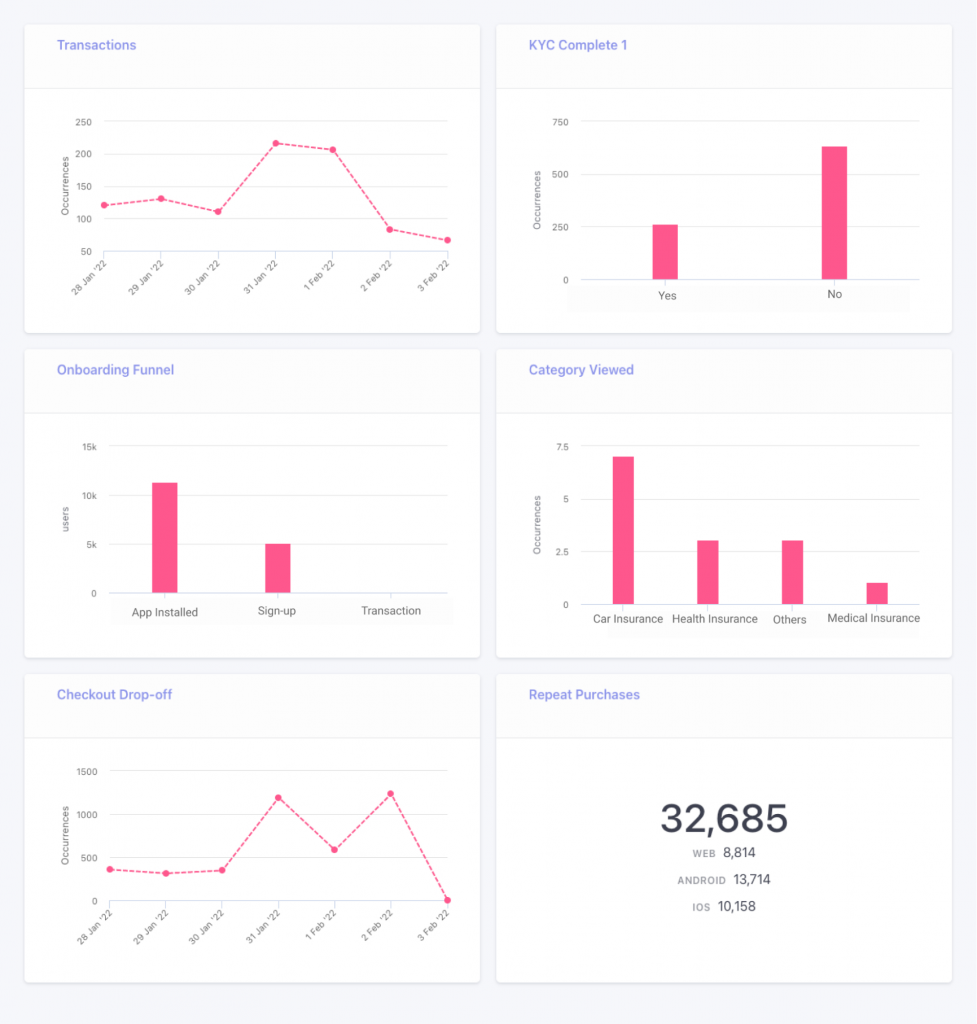
E-commerce
-
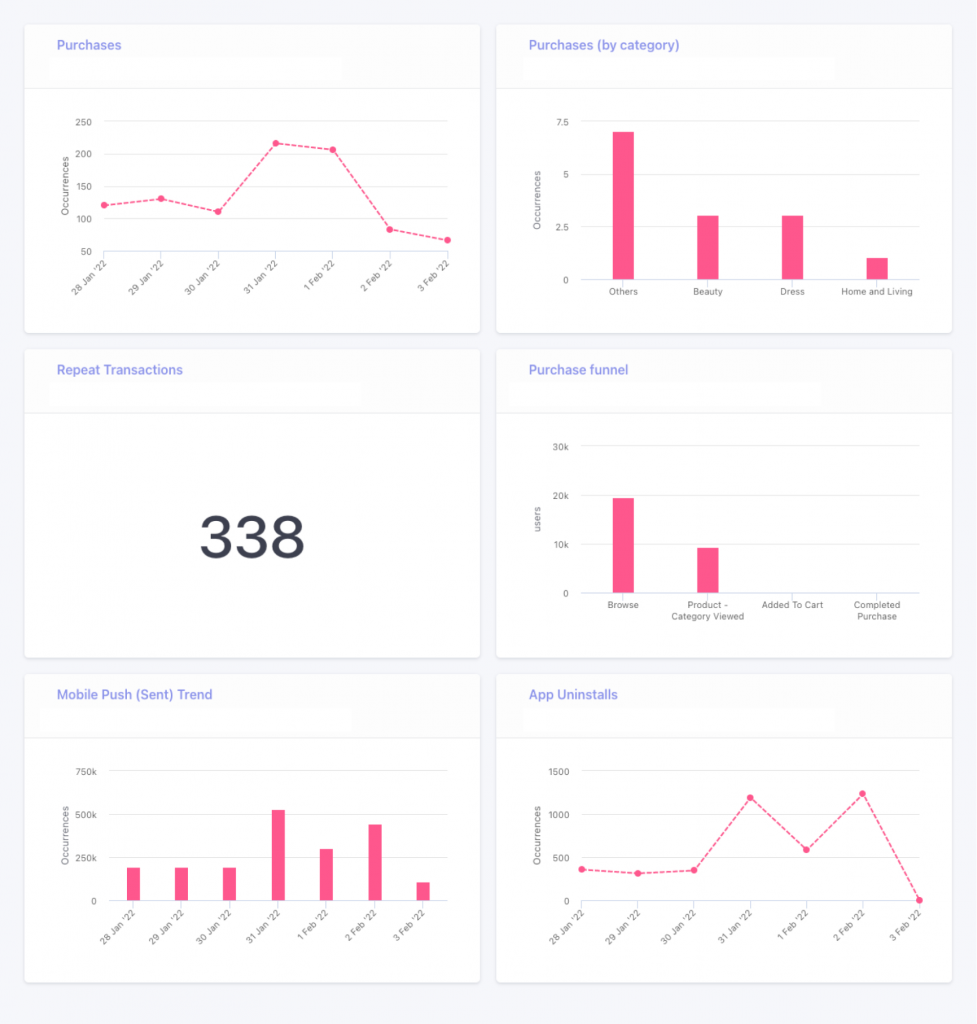
For E-commerce marketers, it’s important to track metrics like the number of transactions, average order value, repeat purchases, abandoned cart events, and top categories.
Dashboards can provide you a high-level view of where your users are dropping off in their buying journey, what engagement channels they are reachable on, what are the top categories driving revenue, and the number of repeat purchases.
-
-
FinTech
-
Due to regulatory requirements like the KYC process, FinTech businesses in the investment and lending space witness a lot of drop-offs during onboarding. So tracking the onboarding journey of the customers and making sure they make their first investment on the app/website is crucial.
Also, given the high customer acquisition cost (CAC) in the FinTech industry, monitoring how well you are retaining your customers is important to evaluate the health of your FinTech business.
With the help of dashboards, you can get a high-level view of all your important data points like KYC funnel drop-offs, the number of transactions and failures, onboarding journey, repeat transactions, and MAU monthly trends on a single dashboard.
You can monitor these metrics on a daily basis to analyze how your customers are engaging with your platform and remove any bottlenecks in your customer’s journey.
-
-
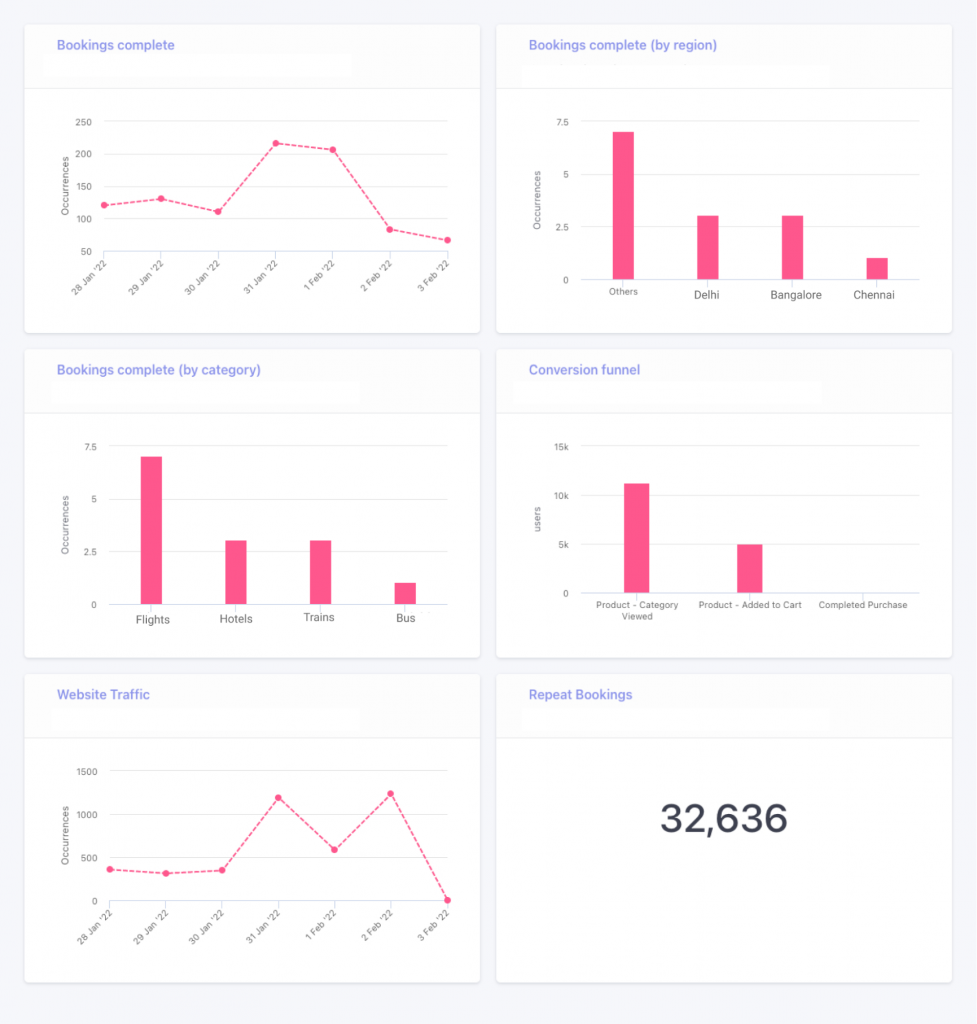
Travel
-
The major challenge that most travel businesses face is booking abandonment – travelers leaving the app/website without booking a trip. With dashboards, you can monitor how travelers are engaging with your platform, how many travelers are making repeat bookings, identify potential drop-off points, and do trend analysis.
-
-
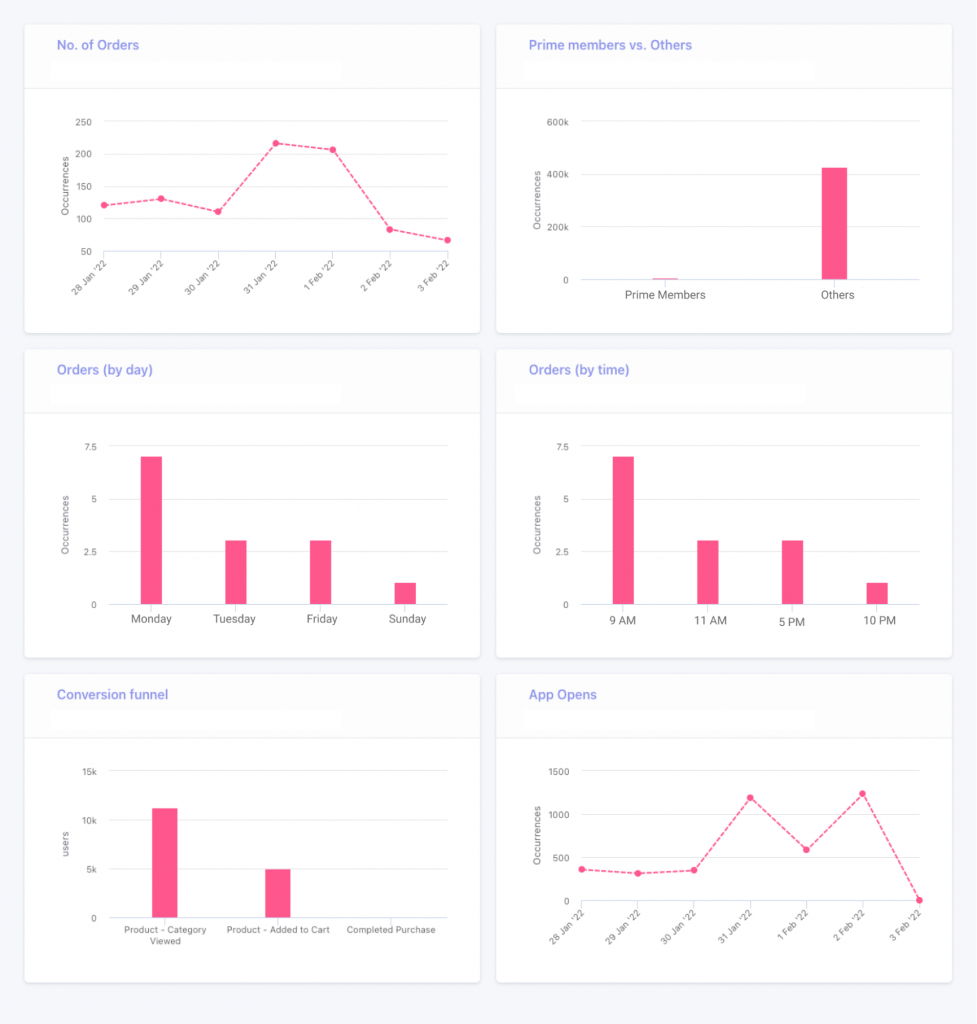
FoodTech
-
For FoodTech marketers, it’s crucial to keep a track of different customer segments like new users, active users, inactive users, etc. to run targeted campaigns based on different user profiles. With Dashboards, you can keep your reports organized by geography, user segments, etc., and do deep analysis based on your business goals.
-
-
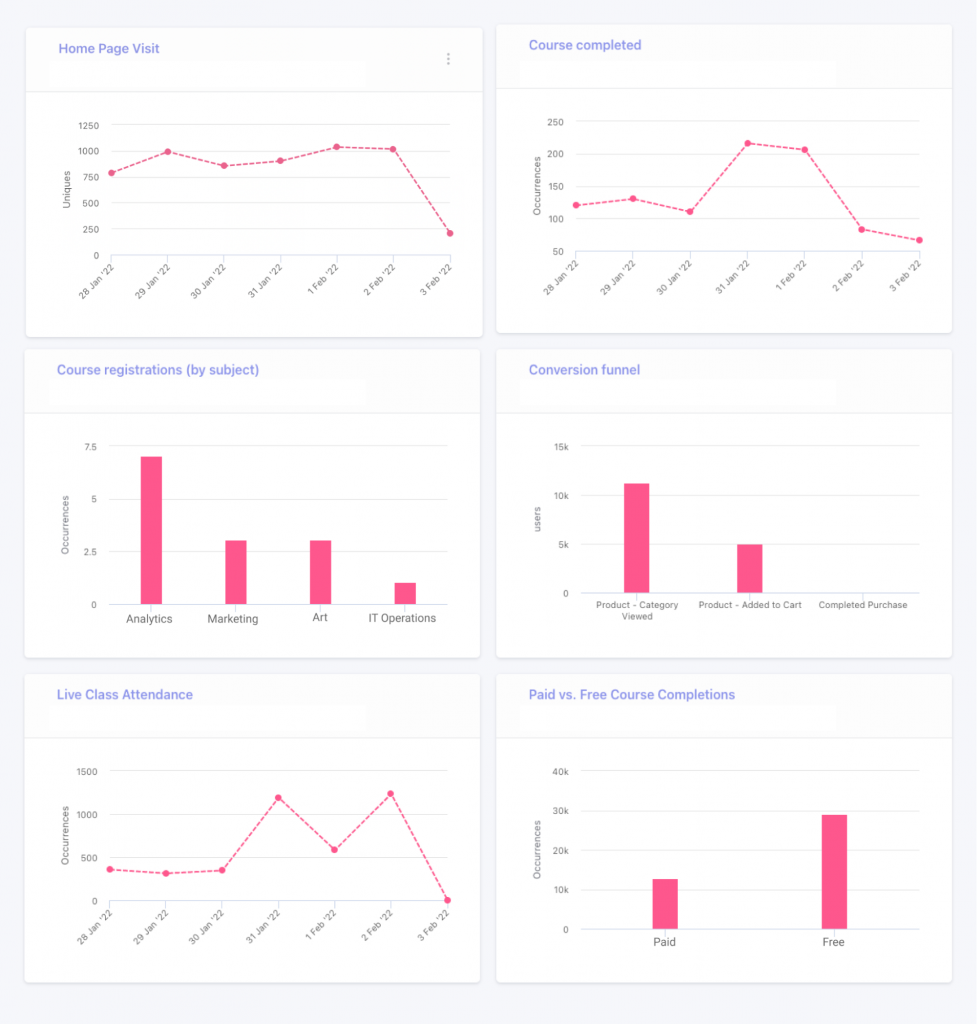
EdTech
-
For EdTech, key metrics you can track include courses purchased, MAU, courses completed, course per learner/user, paying vs non-paying users.
Wrapping Up
Now that you understand how Dashboards can help you optimize your overall marketing strategy, do try out the new feature and let us know your feedback. If you need more assistance, get in touch with your Account Manager or reach out to sales@webengage.com to get started.
Take a demo with WebEngage and Micro-manage your Campaign with an Array of Metrics

 Ananya Nigam
 Harshita Lal
 Prakhya Nair