


In the last twenty years, we’ve seen a monumental shift in consumer behavior for travel and hospitality brands. Travelers are increasingly turning their backs on traditional travel agencies, instead opting for online platforms that offer easy, at-home booking and cost-saving deals. Statista Mobility Market Insights states that a staggering two-thirds of the global travel and tourism revenue in 2022 came from online channels.
In light of these trends, how can you ensure your mobile app doesn’t get lost in the crowd but is instead at the forefront, driving your brand toward this rapidly expanding market?
The secret lies in understanding and focusing on the right mobile app metrics. But which ones should you prioritize to improve user engagement and retention?
Well, you’re in the right place!
In this blog, we’ll unveil the top 10 mobile app metrics that are key for any travel and hospitality brand. We’ll provide clear, easy-to-understand insights that can help boost user engagement, improve retention rates, and navigate your brand toward success in the dynamic digital marketplace.
The Importance of User Engagement and Retention for Travel & Hospitality Brands
Picture this: With the online travel market globally expected to soar over $1 trillion by 2028, your travel and hospitality brand is gazing at a vast ocean brimming with potential customers. Your mobile app is up and running, and travelers are boarding your digital vessel. But remember, onboarding these travelers is just the initial step – the real journey lies in engaging them, ensuring they stay aboard, and fostering a strong connection that makes them choose you for their future adventures.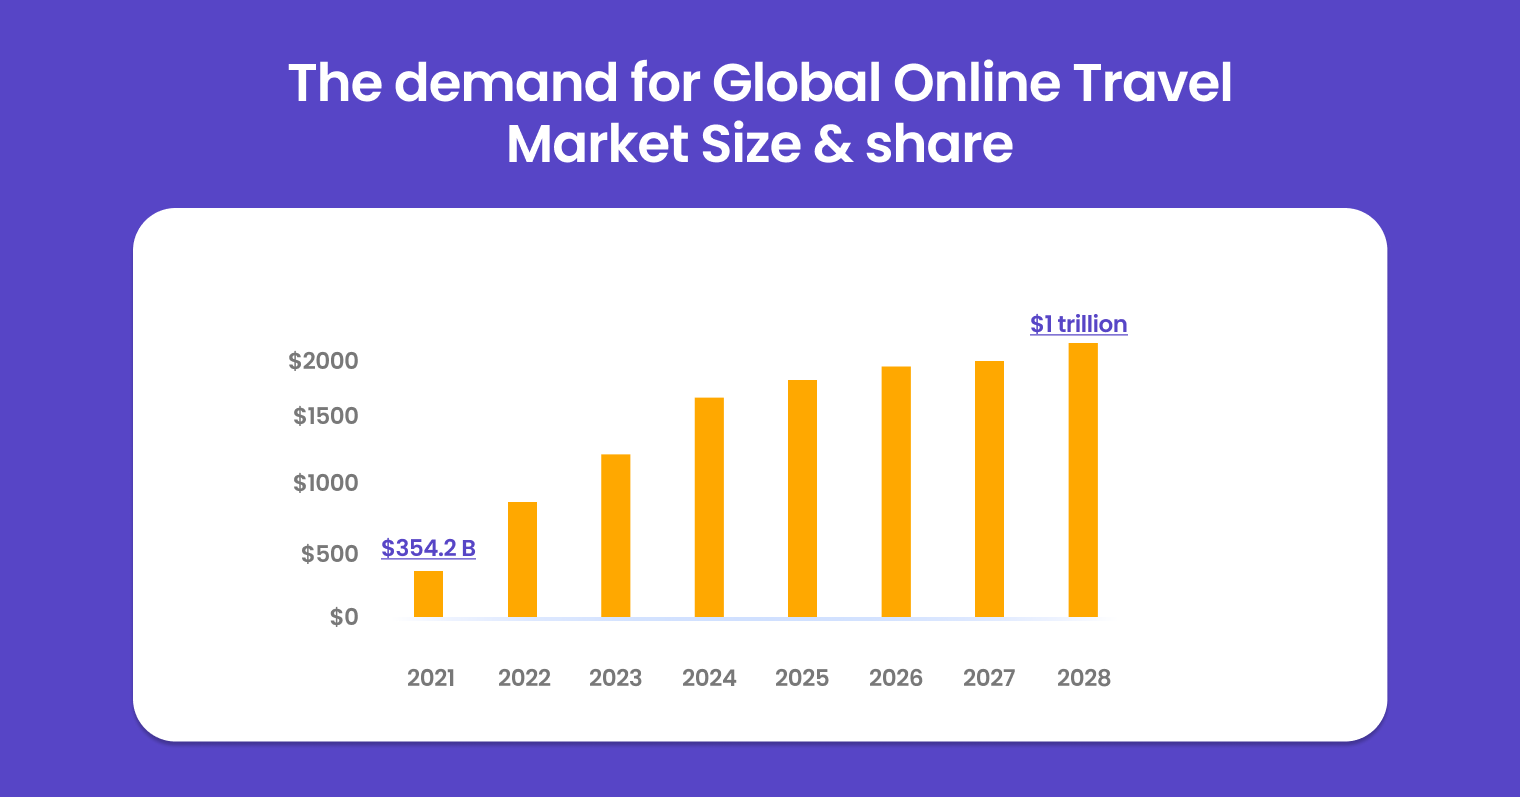
Being in the travel and hospitality industry, you probably comprehend the importance of customer engagement and retention better than most industries. And for those who don’t, let’s deep dive to understand why user engagement and retention are vital for travel and hospitality brands.
What does this growth have to do with user engagement and retention? Let’s have a look.
User Engagement & User Retention: A Symbiotic Relationship
User engagement is the measure of the level of interaction your customers have with your brand. For travel and hospitality brands, it could be in the form of app downloads, website visits, social media interactions, customer reviews, and booking rates.
The key advantage of high user engagement is that it fosters customers’ connections with your brand, thereby enhancing brand awareness, driving growth, and increasing the likelihood of one-time users becoming repeat customers.
User retention, meanwhile, assesses a brand’s ability to sustain customer interest over time. Retaining existing customers is not just cost-effective; it also creates brand ambassadors who can promote your brand extensively. Retained customers often spend more, are more loyal, and provide data that helps improve customer satisfaction.
The relationship between user engagement and retention is symbiotic. Engaged users often become repeat customers, and vice versa. Therefore, focusing on both can establish a cycle of sustainable growth for your brand, ensuring customer interaction doesn’t end with a single transaction.
The 10 Mobile App Metrics to Track
Mobile app metrics are more than just numbers; they are the language of your app, telling the story of your users’ experiences. They shine a light on the habits and preferences of your users, helping you refine your app to suit their needs better, ultimately driving customer engagement and retention.
So, without further ado, let’s dive into the 10 vital mobile app metrics that every travel and hospitality brand must track.
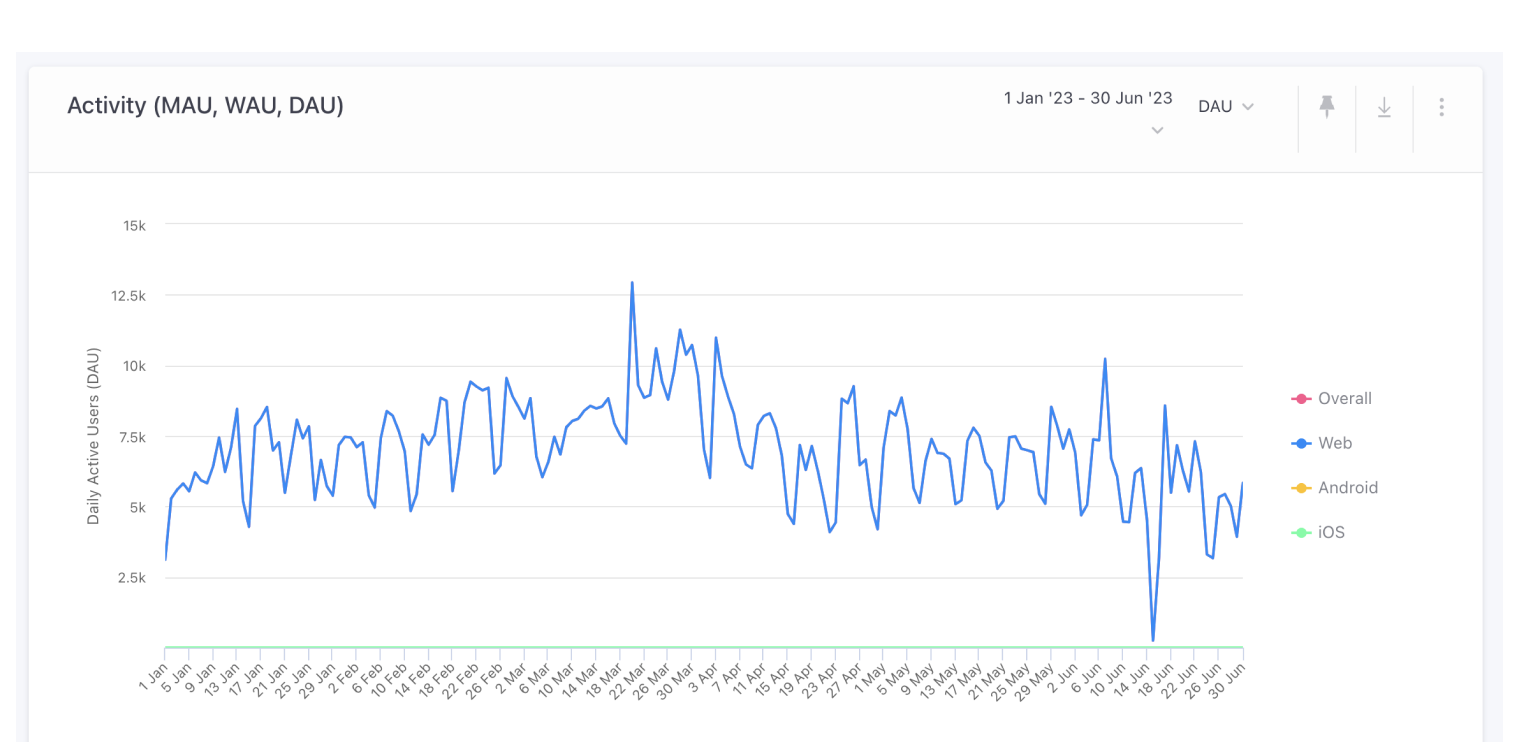
1. Daily Active Users (DAU)/Monthly Active Users (MAU)
Daily Active Users (DAU) and Monthly Active Users (MAU) are fundamental indicators representing your mobile application’s overall health and vitality.
Daily Active Users (DAU)
DAU refers to the total number of unique users who engage with your app within 24-hours . Whether users are searching for new destinations, making reservations, or leaving reviews, each individual user interaction contributes to the DAU.
Suppose on July 6, 2023, 5,000 unique users login to your app to use its features. Regardless of the frequency of their activity on that day, each user counts once for the Daily Active Users (DAU) tally. So, your DAU for this date would be 5,000.
Monthly Active Users (MAU)
Conversely, MAU measures the number of unique users who interact with your app at least once within a month. This metric provides a broader view of your app’s usage patterns and helps identify long-term trends.
To calculate MAU, you would count the number of unique users interacting with your app at least once a month. Let’s consider the month of July 2023. During this month, you track that 50,000 unique users logged into your app at least once.
Again, it doesn’t matter whether a user interacts with your app once or every day of the month; they are counted as one monthly active user. So, your MAU for July 2023 would be 50,000.
Comparing these two mobile app metrics gives you the ‘stickiness’ of your app – a measure of how often users engage with your app. In this case, your stickiness quotient would be 5,000 (DAU) divided by 50,000 (MAU), or 10%.
A higher stickiness quotient suggests that your daily users frequently return to your app within the month, implying a more engaging app experience.
By keeping a close eye on your DAU, MAU, and stickiness quotient, you can get a better grasp of your app’s performance, understand consumer engagement, and design effective marketing and retention strategies.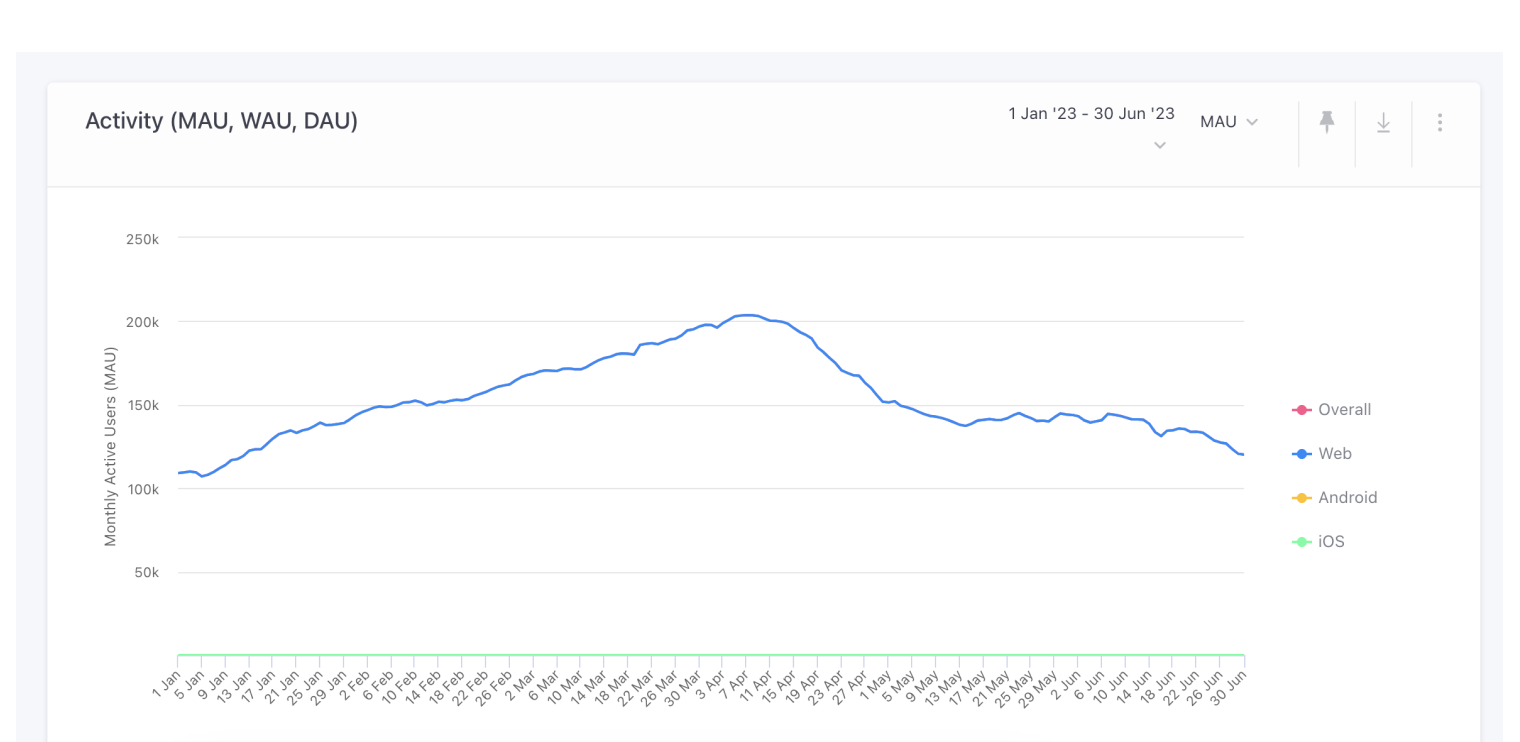
For example, if your app’s DAU consistently peaks on weekends, it implies users are planning and booking trips during their leisure time. Utilizing this information, you can tailor your marketing strategies—like launching promotional offers—to coincide with these peak usage times, optimizing user engagement and driving growth. Thus, tracking and interpreting DAU and MAU can help you deliver a personalized user experience, improving your app’s overall performance.
2. Session Length
Session length is the time from when a user opens your app to when they exit. It shows how long users spend on your app in a single use.
For example, if a user opens your app at 8:00 PM and exits at 8:30 PM, their session length is 30 minutes.
Average Session Length
To gain a more comprehensive view of user engagement, you would look at the average session length across all users.
The average session length is calculated by dividing the total time spent on the app by the number of sessions in a specific timeframe. For instance, if your app had 200 sessions in a day totaling 5,000 minutes, the average session length is 25 minutes (5,000 minutes/200 sessions).
This figure can offer invaluable insights into overall customer engagement and the effectiveness of various features within your app. For instance, if your app added a new feature offering personalized recommendations and saw a significant increase in the average session length, they could infer that this feature was successful in boosting user engagement.
Additionally, if your travel app’s session lengths are short, it could mean the users are struggling to find relevant information quickly, suggesting a need for improved navigation or search functionality. Contrarily, long sessions might indicate extensive engagement or potential decision paralysis due to numerous options. Therefore, understanding session length can guide user experience improvements, enhancing app effectiveness and engagement.
3. Screen Flow
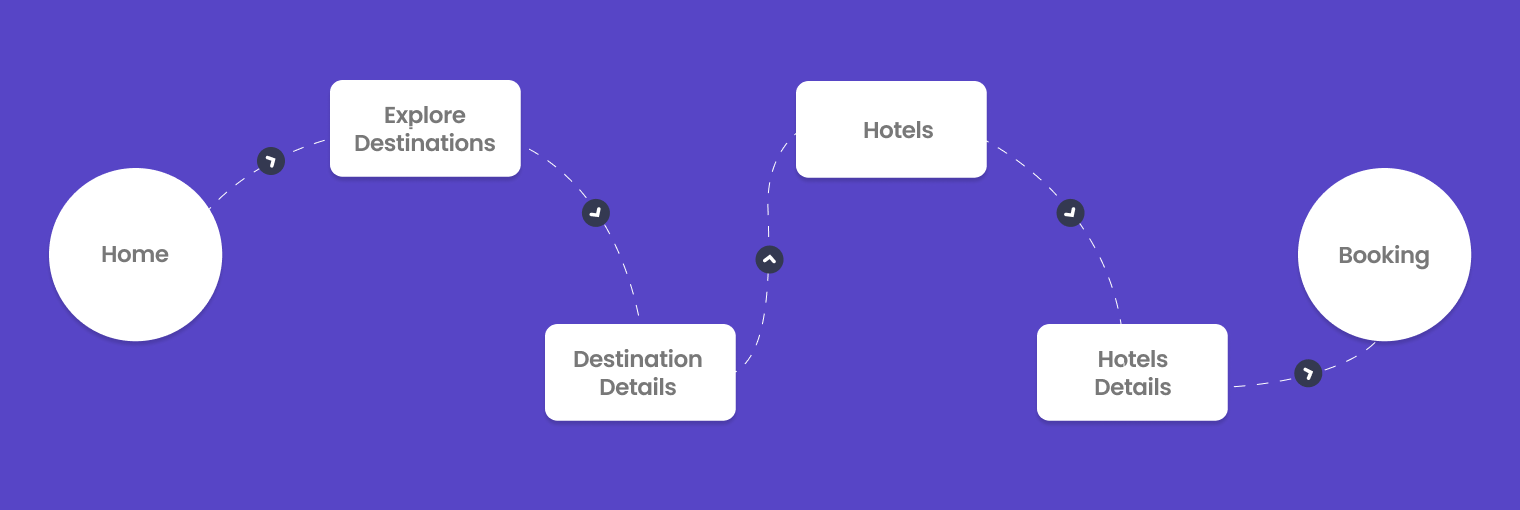
Screen flow tracking follows your users’ paths through your app, providing insights into their behaviors and preferences.
Say your user starts their journey on the home screen of your app, moves to the “Explore Destinations” page, visits a few specific destination pages, then proceeds to the “Hotels” section, reviews a few hotel options, and finally lands on the “Booking” page where she completes her transaction.
If you were to depict the user’s screen flow, it would look something like this:
Home –> Explore Destinations –> Destination Details –> Hotels –> Hotel Details –> Booking
Now, tracking Screen Flows across many users over time gives you valuable data. For instance, if 1,000 users reach the “Explore Destinations” page, and 700 go on to “Destination Details,” you have a 70% transition rate.
Suppose you notice a trend where users frequently drop off after the “Destination Details” screen and before reaching the “Booking” screen. This pattern could suggest a need for a more streamlined navigation system or more compelling calls to action.
With screen flow understanding, you can optimize user journeys, resolve bottlenecks, and design an efficient, intuitive path from home screen to booking.
4. Acquisition Channels
Acquisition channels are the pathways through which users discover and download your app. They can range from organic app store searches, social media ads, and referral links to influencers’ blog posts. It’s crucial to know these channels to measure your marketing efforts’ performance and identify where valuable users originate.
For example, imagine your app’s acquisition channels are organic search, social media ads, influencer marketing, email marketing, and user referrals. At month’s end, you find:
- Organic search: 2,000 users
- Paid social media ads: 3,000 users
- Influencer marketing: 1,000 users
- Email marketing: 2,500 users
- User referrals: 1,500 users
In total, you’ve gained 10,000 new users. To calculate the percentage from each channel, divide the users by the total users and multiply by 100. For example, the organic search’s percentage would be (2,000 / 10,000) * 100 = 20%.
Let’s say, for instance, that influencer marketing brings fewer users (1,000) than paid social media ads (3,000). However, if a higher percentage of those users from influencer marketing complete bookings, it suggests that while the volume is lower, the quality of users is higher.
This insight implies that allocating more resources to influencer partnerships could potentially yield a greater return on investment.
Additionally, by evaluating the Acquisition Channels alongside metrics like Screen Flow, you can start to understand not just where your users are coming from but what they’re doing once they’re in your app.
5. Conversion Rates
Your objective isn’t only to attract users to your app; you want them to perform specific actions, like booking a trip, writing a review, or referring a friend. These actions are known as conversions, and the Conversion Rate is the percentage of users who complete a desired action.
For instance, over a month, you have 5,000 Facebook-acquired users and 4,000 Instagram-acquired users. If 500 Facebook users and 320 Instagram users make a booking, you can calculate the conversion rates as follows:
- Facebook: (500 / 5000) * 100 = 10%
- Instagram: (320 / 4000) * 100 = 8%
Remember our Screen Flow discussion? You discovered most users navigated from the ‘Home Screen’ -> ‘Destination Search’ -> ‘Trip Details’ -> ‘Booking.’ Now, with the Conversion Rate calculated, you can add another layer of data to your analysis.
You see that 10% of users acquired from Facebook completed the conversion action, indicating they navigated through the screens successfully and found value in your app. However, the Conversion Rate for Instagram users is slightly lower at 8%.
This discovery can prompt further analysis. Are Instagram-acquired users dropping off at a particular screen? Is there something about the ‘Destination Search’ or ‘Trip Details’ interface that doesn’t appeal to them? Or perhaps the booking process seems too complicated?
By studying Conversion Rates alongside Screen Flow and Acquisition Channels, you can pinpoint where the user journey falters for different user groups. This approach will allow you to make data-driven decisions to enhance the app experience for users from different channels.
Let’s say you observe the user journey from ‘Destination Search’ to ‘Booking.’ If the conversion rate dips significantly at any stage, it may suggest a potential roadblock in the user experience. For example, a steep drop-off between the ‘Trip Details’ and ‘Booking’ stages might indicate a complex booking process that discourages users from finalizing their plans.
By identifying and addressing these areas of friction, the travel app can optimize the user journey, thus enhancing the user experience and boosting overall conversion rates.
6. Retention Rate
In an ever-growing sea of travel apps, keeping your users hooked to your brand isn’t a walk in the park. Here, the Retention Rate steps in, acting as a critical barometer of user loyalty and the stickiness of your app. It measures the percentage of users who return to your app within a specific period, say, 30 days after their first visit.
Imagine you gained 5,000 new users at the start of June, and 1,000 of them returned within 30 days. June’s Retention Rate can be calculated as follows:
Retention Rate = (1,000 / 5,000) * 100 = 20%
While Conversion Rates assess how well your app turns users into customers, Retention Rate evaluates how effectively these customers are encouraged to return.
For a travel app, the retention rate is a crucial metric, reflecting user loyalty and the app’s ‘stickiness.’ A high retention rate means users not only downloaded and used the app but found enough value to return and engage further.
If your travel app exhibits a high retention rate, it suggests that users continue to utilize it for future travel planning and bookings, thus becoming repeat customers. This pattern indicates a successful user experience, driving ongoing engagement and fostering loyalty.
However, high Conversion Rates with low Retention Rates could indicate an issue; perhaps users don’t find enough value to come back, or an initially appealing feature loses its charm over time.
Investigating your Acquisition Channels can help here. Maybe a certain channel’s users have low retention despite high conversion. These insights can steer your marketing efforts toward more fruitful user segments.
Disclaimer: Retention rates are interdependent on various other mobile app metrics and factors and are not a single independent metric.
7. Churn Rate
Churn Rate represents the percentage of users who stop using your app within a specific period.
If you began July with 15,000 active users and 3,000 stopped using your app by month’s end, your Churn Rate would be:
Churn Rate = (3,000 / 15,000) * 100 = 20%
A high Churn Rate could suggest various issues, like difficult navigation causing short session lengths, lack of perceived value leading users not to return, or an Acquisition Channel delivering high numbers of users who churn quickly.
Addressing this promptly could mean adjusting the user interface, providing personalized recommendations, or sending push notifications to encourage re-engagement.
Tools like WebEngage’s Marketing Automation are great for experimenting with and optimizing your in-app notifications. Using these tools, you can transform data into action and quickly maximize user engagement.
8. Customer Lifetime Value (CLTV)
Customer Lifetime Value (CLTV) estimates the total revenue a customer is expected to generate over their relationship with your app. It represents the net profit from all future purchases a customer will make, which is critical for sectors like travel, where repeat customer interactions and user retention drive sustainable growth.
For instance, if an average user’s monthly purchase value is ₹5000 and they make purchases every three months, their annual value is ₹20,000. Given an average customer lifespan of three years, the CLTV is:
CLTV = ₹5000 * 4 * 3 = ₹60000
This means an average customer is projected to generate ₹60000 in revenue over their relationship with the app.
By evaluating the CLTV, your travel app can anticipate the prolonged revenue potential of its customers. This analysis can lead to the formulation of effective strategies such as introducing personalized offers, launching loyalty programs, or even conducting targeted marketing campaigns, all tailored to enhance customer value.
For example, an individual user might show an inclination towards weekend getaways every few months. By analyzing this user behavior, you can provide personalized offers such as discounts on their preferred destinations or deals on weekend packages, thereby encouraging repeat purchases and increasing the CLTV.
9. In-App Feedback
In-App Feedback is how users express their views about your app directly within the app environment. It provides users with a quick and convenient platform to communicate their thoughts, suggestions, and experiences. This kind of feedback can range from simple star ratings to detailed comments on different aspects of the app.
Suppose your travel app users frequently report issues with the hotel booking feature, such as slow processing or crashes. You can leverage this feedback to improve the app’s features, enhancing user experience and reducing frustrations. This action increases user satisfaction, encourages repeat bookings, and, in turn, augments the customer lifetime value (CLTV).
Moreover, requesting In-App Feedback itself can contribute to customer engagement. By asking for feedback, you communicate to your users that their opinions matter and that they are an integral part of your brand’s journey.
10. Net Promoter Score (NPS)
The Net Promoter Score (NPS) is a key metric used to measure customer loyalty and satisfaction within your app. It is determined by asking your users one simple question: “On a scale of 0 to 10, how likely are you to recommend our app to a friend or colleague?“
Based on the responses, users are divided into three categories:
- Promoters (score 9-10): These are loyal users who are likely to continue using your app and recommend it to others, thus contributing to your app’s growth.
- Passives (score 7-8): These are satisfied but unenthusiastic users who could potentially be swayed by the offerings of competitors.
- Detractors (score 0-6): These are unsatisfied users who could potentially harm your brand reputation through negative word-of-mouth.
To calculate your NPS, you subtract the percentage of detractors from the percentage of promoters. For example, if out of a sample of 200 users, 100 are promoters, 50 are passives, and 50 are detractors, your NPS would be:
NPS = 50% (percentage of promoters) – 25% (percentage of detractors) = 25
The NPS ranges from -100 (if every user is a detractor) to 100 (if every user is a promoter).
By tracking your NPS alongside other mobile app metrics, you can gain a deeper understanding of your user base. This helps you understand where you stand from a user’s perspective, allowing you to make informed decisions to optimize your strategies and improve consumer engagement and retention.
Bonus Point: Cohort Analysis
Cohort Analysis is a powerful tool that can help travel, and hospitality brands understand user behavior, engagement, and retention. It’s a type of behavioral analytics that allows you to see patterns clearly across the lifecycle of your customers (the cohort). This analysis can provide valuable insights into drop-offs, crucial for improving user engagement and retention.
A cohort is a group of users who share a common characteristic over a certain period. For travel and hospitality apps, cohorts could be users who installed the app in the same month, users from the same geographic location, or users who booked their first trip or hotel within the same time frame.
Understanding drop-offs through cohort analysis involves tracking these groups of users over time and identifying at what point and why they stop using the app. For example, you might find that a significant number of users drop off after their first booking. This could indicate a problem with the user experience during or after the booking process.
Cohort analysis can also help you identify trends and patterns that are not immediately apparent. For instance, you might notice that users from a particular location have a higher drop-off rate. This could indicate a need for localized marketing efforts or app features.
Here are some steps to perform a cohort analysis:
- Define the Cohort: A cohort could be users who installed the app in the same month, from the same geographic location, or who booked their first trip or hotel within the same time frame.
- Define the Event: The event could be anything from app installation, first booking, or even a specific feature usage within the app.
- Define the Time Frame: The time frame could be daily, weekly, or monthly. It depends on the nature of your app and the specific user behavior you’re interested in.
- Track User Behavior Over Time: Use an analytics tool to track the behavior of each cohort over time.
- Analyze the Results: Look for patterns and trends. Are users dropping off after a certain point? Is there a cohort that has a higher retention rate?
By understanding when and why users drop off, you can implement strategies to improve user engagement and retention. This could involve improving the user experience, offering incentives to re-engage users, or personalizing the app experience based on user behavior.
As illustrated in the graph above, customer retention in the travel and hospitality sector tends to be lower compared to other industries. This highlights the importance and urgency of focusing on user engagement and retention strategies in this sector. By tracking mobile app metrics such as drop-offs through cohort analysis, brands can better understand user behavior and engagement patterns.
The infographic below provides a clear picture of how tracking these metrics can positively impact your customer engagement and retention.
10 Must-Know Mobile App Metrics to Boost Engagement and Retention in the Travel and Hospitality Industry
Turn Metrics Into Results With WebEngage
Tracking the right mobile app metrics can provide valuable insights into user behavior, paving the way for improved user engagement and retention. Understanding your users is the first step in offering them a memorable and beneficial app experience.
However, having the right mobile app metrics is only half the battle. To translate these insights into actionable strategies, you need the right tools at your disposal.
Enter WebEngage – your partner in delivering unique mobile app experiences. By harnessing behavioral data and targeted segmentation, WebEngage ensures a personalized experience across your mobile app, making each user’s journey as unique as they are.
Are you ready to turn metrics into results? Book a demo with WebEngage today.

 Amit Shinde
 Rohit Taneja
 Harshita Lal
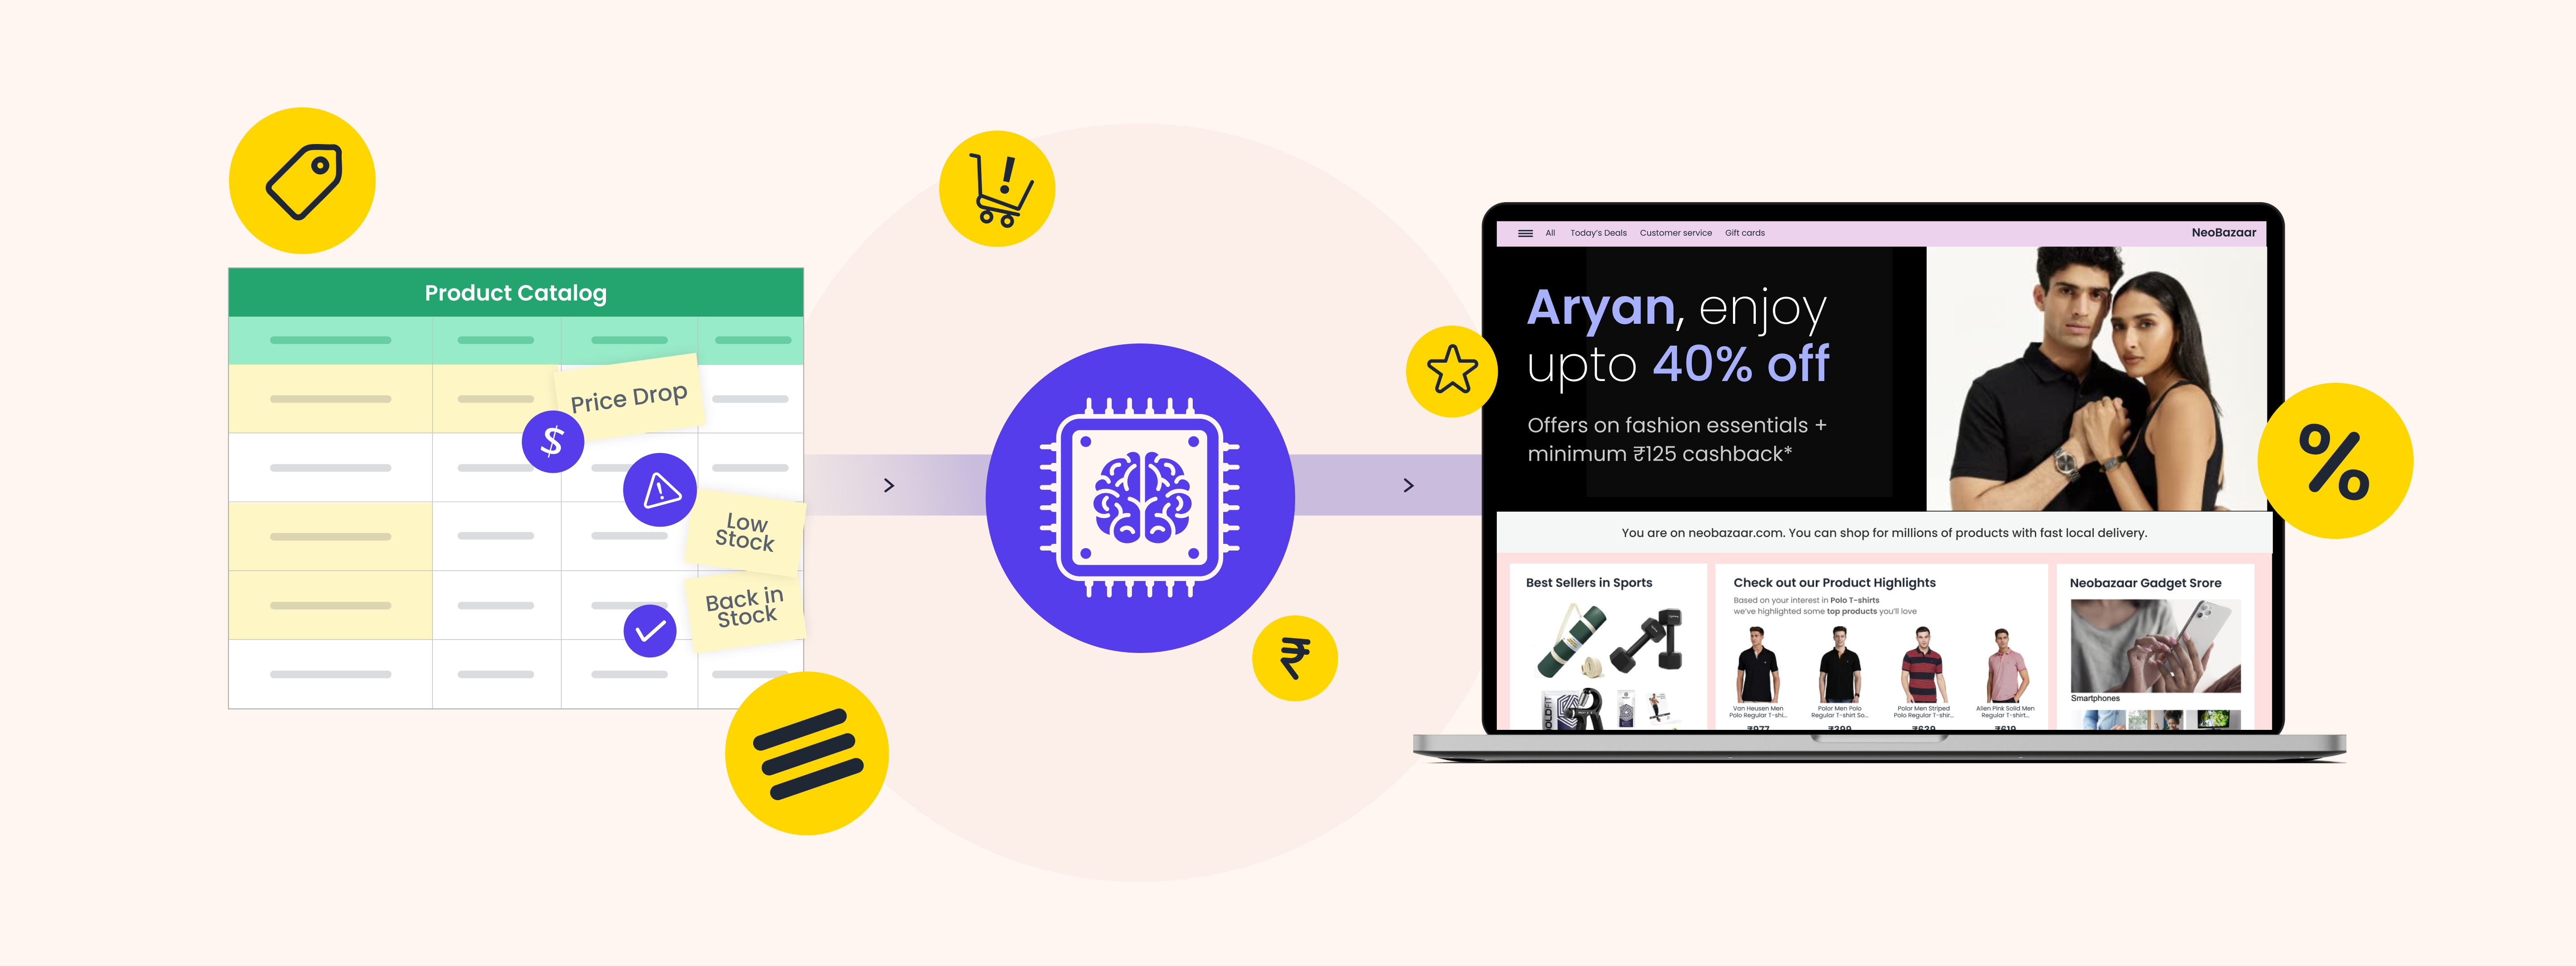
 Manoj Chawda

 Tina Verma