


Introduction
Mobile marketers know that a lasting marketing or growth strategy does not end at acquiring new customers but ensuring that existing ones stay..
Getting lost in vanity metrics such as app downloads or daily active users that do not guarantee any traction is a recipe for disaster. For any marketer, there is nothing more alarming than losing most or part of their valued customers within weeks or days of acquisition.
Did you know there’s only a 5-20% chance to sell to a new customer as opposed to a whopping 60-70% for a repeat customer?
To prevent your customers from leaving your app, it’s imperative to prioritize customer retention. Retaining existing customers is 5x cheaper than acquiring new ones and most businesses with low customer loyalty can spiral into negative returns.
But before we can jump into stopping customers from leaving, data comes in the way- not just any data, but exact figures that tell you about the behavior and characteristics of your customer base. In such a case, Cohorts become a salient technique.
Today, marketers are in much better shape than they’ve ever been when it comes to using data to understand and dissect user behavior, habits, and traits, which is where most teams turn to Cohort Analysis.
What is Cohort Analysis?
Cohort Analysis helps you to read data, categories, and patterns and empowers teams in extrapolating marketing decisions. Simply put, this is a marketer’s lens to identify opportunities and engage customers for maximum impact by studying behavior over a period of time.
Cohorts are batches of users with stronger characteristics and shared experiences over a specific period. They are bifurcated based on their actions. This can include new and existing users and their behaviors, such as repeat purchases or inactivity.
This process makes it easier to understand user engagement over time and identify patterns or areas of friction, improve user engagement, and retain customers.
How are Cohorts Different from Segments
If you’re just getting started, it’s easy to get confused between cohort and segment analysis – both methods are not interchangeable; in fact, they complement each other. The former is an analytical process bounded by time and identical user behaviors where the data of similar audiences are studied over a period to gauge their engagement patterns, while the latter is about dividing a large set of data into small groups based on common interests, demographics location, behavior, etc.
For instance, customers who download the app and make their first purchase within 30 days can be called a Cohort. However, all customers who downloaded the app become your segment.
It is a subset of a segment where the time period is an important factor. Analyzing customers based on behavioral analytics, their actions, and grouping them in small batches rather than treating the entire batch as one big data over a specific period of time is called Cohort Analysis.
Marketing teams can use Cohort Analysis to track customer behavior and actions and gain better insights into unique user needs over a specific period of time. Cohort Analysis empowers teams to tailor campaigns and build strategies that drive customer retention.
Key Use Cases for Using Cohort Analysis
Imagine you want to sell a subscription pack to your users – now, would you instead spray and pray or select a handful of loyal users who love using your product and have a high app open-to-consumption ratio? Latter, right? We guessed so too.
Marketing teams can use Cohort Analysis to understand various challenges or low-hanging opportunities from product marketing to acquisition.
- Customer retention: Identify customers who have entered your loyalty group or those who are hibernating. Cohort analysis can help you track promising users for a specific event (e.g., users who have added items to the cart but not purchased in the last 45 days) or those who are diminishing from the value life cycle (e.g., users whose average order value is decreasing since a month) – Cohort Analysis can help identify patterns.
- Product performance: By tracking cohorts of users who started using a product or feature can help you analyze their usage patterns and identify areas for improvement to enhance product performance.
- Marketing campaigns: By tracking cohorts of users exposed to a particular marketing campaign, you can analyze their behavior and determine the campaign’s impact on user acquisition and retention.
- A/B testing: By comparing cohorts of users exposed to different versions of a product or feature, you can analyze their behavior and determine which version performed better.
- User engagement: It analysis can help identify trends in user engagement over time.
For instance, you could make cohorts of people who have signed up from specific channels and then analyze their engagements after a month or a quarter. This will give you insights into which acquisition channel is giving you an engaging audience.
Types of Cohort Analysis
Broadly, it can be bifurcated into two wide categories, behavioral and acquisition cohorts; however, marketers can go as deep in analyzing the data as they need. Here are a few types of Cohort Analysis you can try and test.
- Time-based Cohort Analysis: This analysis touches upon users basis the time they first used the app or service and tracks their behavior over time. Building time-based cohorts can help you learn about the user’s engagement rate over a period of time and help identify patterns to make informed product decisions.
- Acquisition Cohort Analysis: Acquisition analysis focuses on the set of users based on the channel they have been acquired from – paid, organic, social, or affiliate. Marketers then bifurcate users based on their ingress points to monitor their behavior. This helps marketing teams understand the channel’s efficacy and user’s stickiness from one source over another and allows teams to double down on their marketing investments.
- Behavioral Cohort Analysis: This analysis focuses on grouping users based on their behavior or actions. Marketers heavily rely on this data to help identify user segments with different needs and preferences and tailor their products or service to meet those needs better.
- Segment Cohort Analysis: Segment analysis can help them study users’ basis of their purchasing habits – specific product purchase, demographics, feature purchase, or signing up for a particular paid service. This can help marketers design tailor-made services or products for specific segments by bifurcating users based on their depth and breadth of investments.
- Event-based Cohort Analysis: As the name suggests, bucketing – users based on any action or event performed by them allows teams visibility in validating hypotheses.
By analyzing how various groups or cohorts utilize their products, the company can detect flaws in their marketing tactics and determine the most effective means of communicating with different customer segments.
Moreover, the company can leverage this tailored data to devise incentives that encourage customers to continue using their products, particularly when they exhibit indications of discontinuing their purchases.
How to Read, & Comprehend a Cohort Table
The cohort table maps out the life cycle of a user from day 0 to day N (0 and N is the window of your time).
In the below table, we are looking at the engagement levels of a batch of users within the first 7 days. As a marketer, you can obtain this data from customer teams and import it into Excel or use a tool like WebEngage, where it’s automatically updated in real-time.
During scrutinizing tables on WebEngage, you can follow the rows or columns with the darkest shade of blue. The above table displays a start event and a returning event. The start event signifies users who downloaded the app on day 0, and the return event represents users who returned or churned.
The table attests that 34.9% of users at an overall level performed the return event within the same day of installing it, followed by 7% of the remaining users on day 1, and so forth.
The above chart makes it incredibly easy to infer when users are leaving the app.
Hypothesis 1: There was a challenge with the app on March 10
Hypothesis 2: User motivation took a hit which resulted in poor interaction
The takeaway from the above table is the D0 retention which needs to be solved, followed by D1. Having identified the problem area, you could further drill down on demographics, acquisition channels, OS, device, and other details about the users to understand what’s causing the churn.
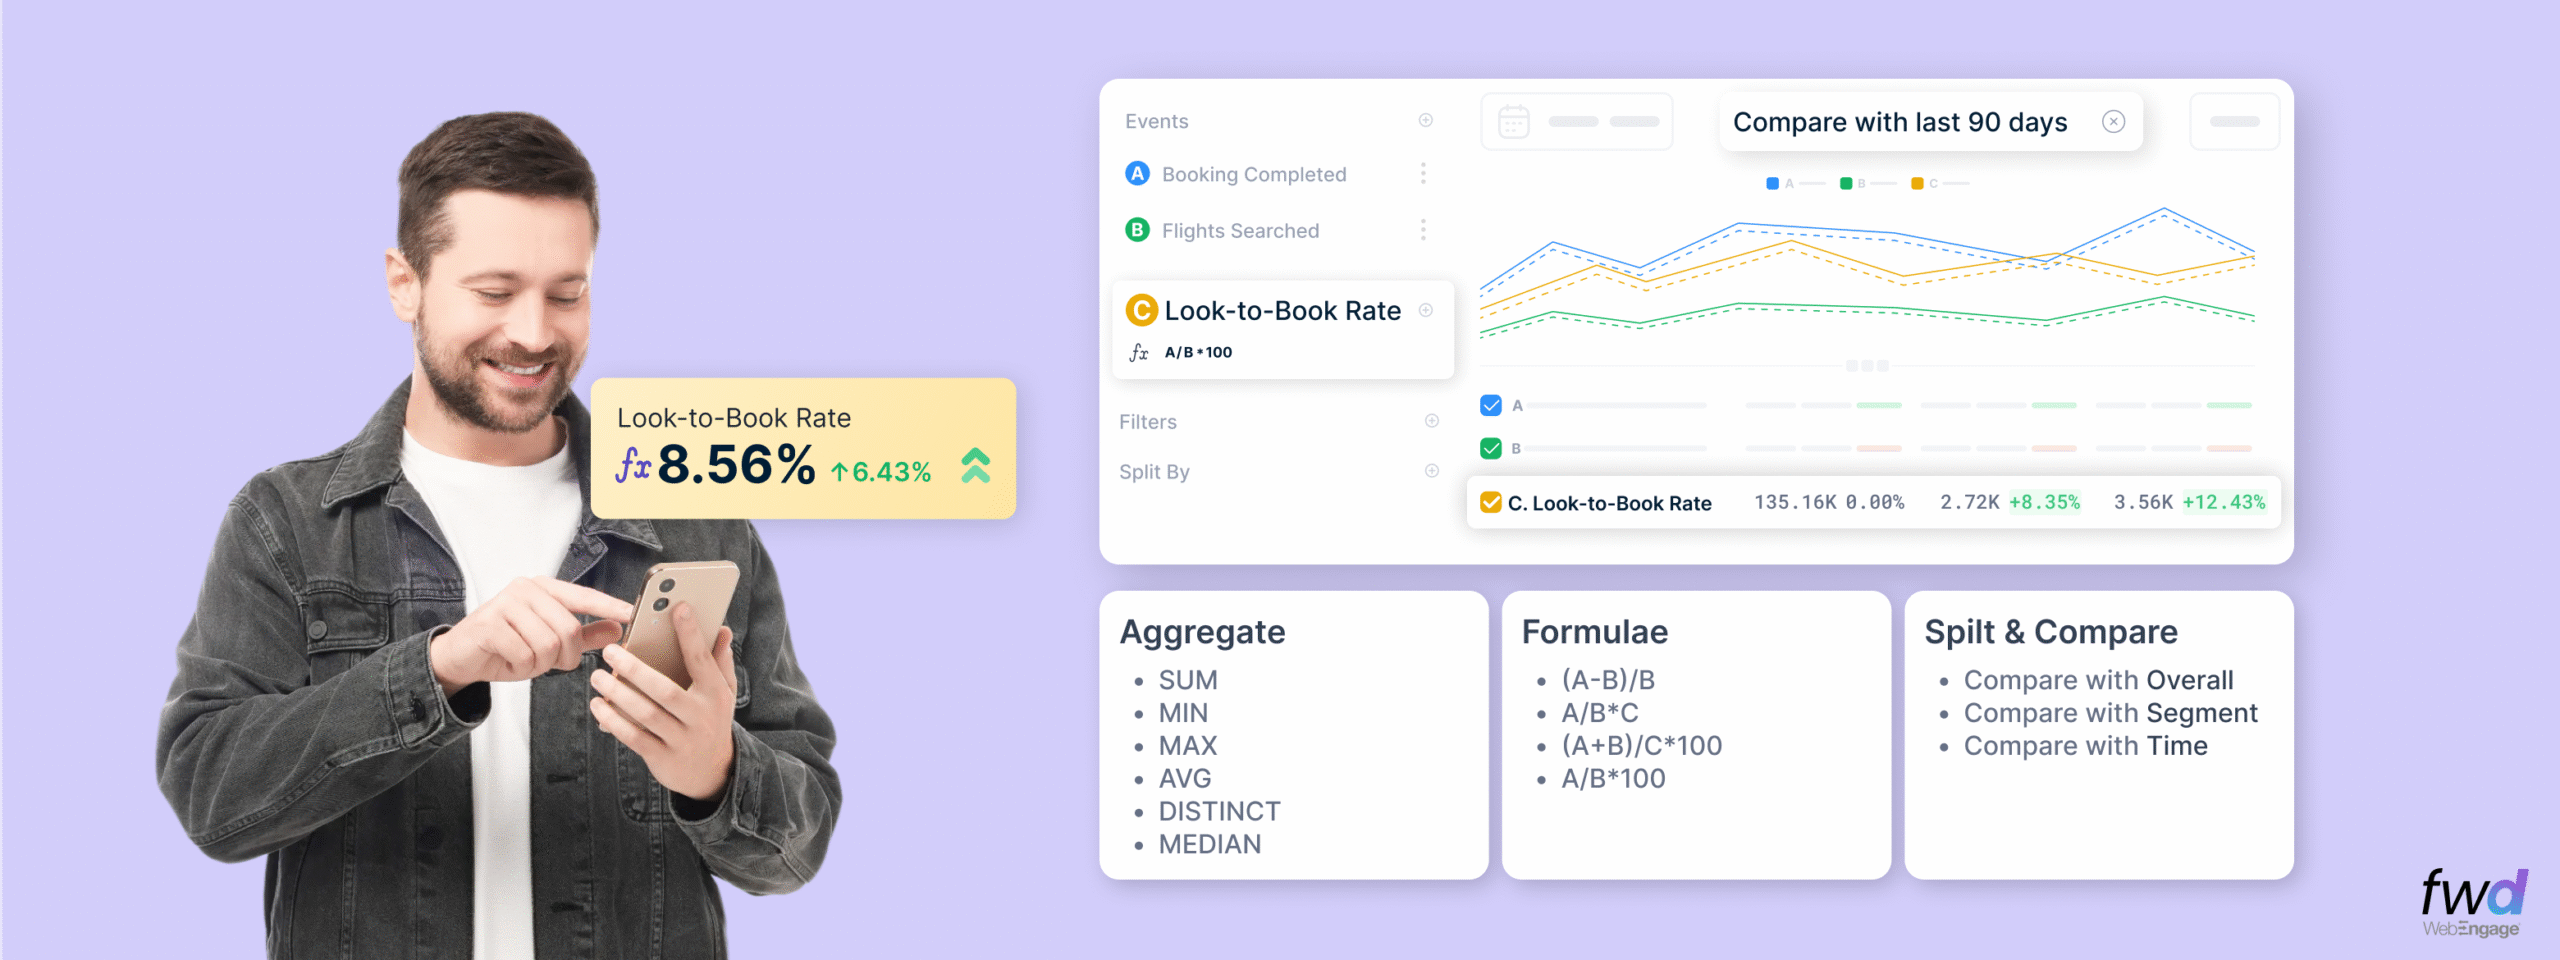
Metrics to Measure your Cohort Table
Cohort tables are a marketer’s arm to derive insights into the product and user psyche towards it.
For example, you can leverage a cohort table to map users’ behavioral patterns and decode the inadequacy in your app, which enables you to deliver improved app experiences, build customer trust, and increase retention.
This analysis helps holistically decode the app’s health, features, and stickiness. While the most common use case of building cohorts is to take a crack at user retention across a category, feature, or at an app level, there are few metrics that can help explore other aspects of the user’s behavior as well.
- Retention rate: Retention sits at the core of the app’s performance and tracks the percentage of users who stick around, remain engaged, or perform any event on the app. To calculate retention, divide your total active users by the number of users at the start.

So imagine if you had 100 customers at the beginning of January, and you acquired 20 new customers, and a total of 10 customers churned from the system. You’re now left with 110 customers, so your retention rate would be:
(110-20)/100 = 90%
- Churn rate: While retention tracks the users retained on the app, churn tracks the ones who have left.
 For instance, if a SaaS company had 1000 paying customers at the start of the month, and 100 of them canceled their subscription service, the company’s churn rate would be 10%.
 - The average revenue per user (ARPU): Some apps also use cohort tables to analyze ARPU over a span of time. To calculate this, divide the total revenue generated by the number of users in that cohort.

- Customer Lifetime Value (CLTV): CLTV can help you understand how much value the customer is going to get to the business over a period of time, and cohorts can help you measure it.The easiest way to calculate CLTV is Customer lifetime value = customer value x average customer lifespan. Here, the customer value is the average amount and frequency of a customer buying from you. The customer lifespan is the total number of years they have stayed active with your product divided by the total number of customers.
 You can do this by multiplying the average revenue per user by the estimated time that user was a customer.
 - Conversion rate: It tracks the percentage of users who take a desired action, such as purchasing or signing up for a subscription. Divide the number of users who take the desired action by the total number of users in a cohort.
- Cohort size: Cohort size means the number of users sharing a common characteristic over a specific period within a said group, segment, or cohort. For instance, if an OTT app has 100 new sign-ups in January and about 140 sign-ups in February, the cohort size of new subscribers would be 100 and 140, respectively, for those months.
The above metrics are just the tip of the iceberg in the vast ocean of retention management for your customers. Marketers and product owners can explore and dissect each table, cohort, pattern, and hypothesis at a granular level to dig deep into customer insights.
While these metrics stay common across industries, it all leads us to calculate the customer retention rate at a daily, weekly, monthly, or any other specific time frame suitable for your business.
Let’s say an e-commerce company in India has 15,000 customers at the beginning of the monsoon season. During the season, they lose 1,500 customers and gain 2,000 new customers.
The customer retention rate for the monsoon season will be calculated as follows:
Customer Retention Rate = ((Total Customers at the End of the Monsoon Season – New Customers) / Total Customers at the Beginning of the Monsoon Season) x 100
So, in this case, the customer retention rate for the monsoon season would be: ((15,500 – 2,000) / 15,000) x 100 = 86.67%
So if anyone at the company wants to learn what was the retention during monsoon (specific to the time range), it was 86.67%, which is still a great place to be at. Most businesses in India get impacted during monsoon because logistics takes a hit, yet, this company was able to sail through.
Customer retention rate (CRR) is the percentage of customers who are retained over a given period of time. To calculate the retention rate, you need three metrics
-
- Customers at the start of the given period
- Customers at the end of the given period
- New customers acquired during that period.
The formula then goes as follows

For example, if you had 1000 customers at the start of the period, and nearly 100 new customers joined you, and 500 customers remain at the end of the same period, then the math looks like this:
CRR = ((500-100)/1000)*100
CRR = 40%
Meaning you retained 40% of your customers from the said period. Now some industries have higher retention than others simply because of the nature of the service or the nomadic attitude of the audience.
The 40% is more towards the alarming end of the spectrum, but anything beyond 70% is considered a good CRR.
Analyzing Cohort Metrics
A marketing strategy is only as good as its experiments and hypotheses – identifying low-hanging fruits, double tapping on problem areas, predicting a problem, and extrapolating data to avoid a potential challenge; the job is a never-ending affair when it comes to behavioral data of your users.
An integral part of this liaison between marketers and their numbers are cohorts – the potential set of insights of a batch of users that can make or break your campaigns. Analyzing cohorts requires several steps & channels. Let’s explore how you can get started today.
-
- Identifying trends: Having a knack for identifying trends can help teams build a full cycle of experiments that generate value for business over and over. Identifying trends early on gives you leeway to plan your strategies in the right direction.
When Dropbox realized their users were collaborating on the platform, like sharing images or any other event, they brought in growth by inviting new users. Dropbox immediately incentivized all its users for it, unlocking a massive growth in revenue for them. - Comparing cohort groups: Another great insight generator is a comparison of different cohort groups across changing elements – the same set of users across different times, different users adopting the same feature, & many such iterations. The comparison allows teams to look at user behavior and analyze how users act differently from each other.
This allows teams to replicate winning strategies across any products or services. - Interpreting data: A high churn rate could be fine for a free application with open access, but it could trigger worry for a subscription-based service. Thus, interpreting data ought to be in full context with the nature of the business. By understanding the context surrounding your data like
For instance: if you talk about users then are they unique or newly acquired, or just regular users of the app, you can make better-informed decisions about strategies to enhance the performance of your business.
- Identifying trends: Having a knack for identifying trends can help teams build a full cycle of experiments that generate value for business over and over. Identifying trends early on gives you leeway to plan your strategies in the right direction.
Cohort Analysis using WebEngage
Running a Cohort Analysis on WebEngage is straightforward and incredibly easy. In less than 5 clicks, product teams and marketers can land into a pool of actionable data on their users’ behavior.
To get started, click on the drop-down icon on the left side of your WebEngage dashboard and tap on cohorts. Once you reach this section, use the filters at the top to introduce parameters that will help you understand your audience.
From an action as small as an app install to an app open to something as critical as a subscription bought or activity conducted, the platform allows you to monitor every minuscule detail at a very granular level.
Once done, you can move on to the cohort table populated below this; it would look something like this. On the left-hand side, you see days, the starting period being at the top and the latest or the ending period at the bottom.
How you want to read this table is one column at a time rather than going from row to row.

In the above table, as you can see, the darker shades of blue highlight users’ activity. The darker the blue, the stronger or higher the percentage. For instance, if you look at data from November 6, you’ll see it’s the poorest of all days. Even though users performed the action on day 0, the percentage of users who came back for the return event was low.
Campaigns to Run After Identifying Your Cohorts
So now you have a fair understanding of how Cohort Analysis works, how to read the table, and how to identify gaps. What do you do with all this insight? What’s the next step?
Well, there is no stopping the kind of executions marketers can do post Cohort Analysis, but here is how to get started.
-
- Email Campaigns: Imagine you landed on a cohort that adds items to the cart but always drops before checking out. To this batch, you can send personalized emails about the value of the product, some user testimonials, or even a discount code.
- Reward/Loyalty Programs: Cohort campaigns are always great because you can treat a particular set of users differently and take that insight into building a long-term feature. Imagine you launch a coupon code for users who cross a specific mark, which trickles into engaging behavior.
- Offers: Offering discounts or free shipping offers can incentivize customers to purchase. You can segment your customers based on their buying behavior and provide tailored discounts or offers to encourage them to buy more.
- Reactivation Emails: So you found a cohort that was relatively active for the first few weeks but then slowly entered a lull period – reactivation email is here for the rescue. These emails can offer incentives or remind your users of the benefits of your products. Some also call this a resurrection campaign.
- AOV Management: Implementing an average order value (AOV) management campaign can increase customers’ spending per purchase. Offering tiered discounts or free shipping on purchases above a certain amount can encourage customers to spend more.
How to Develop Action Items from Your Report
Any good marketer knows real success is not about just making users download your app – the journey starts after that. It is easy to look at data in isolation and get lost in vanity metrics such as app downloads or app open, but if you genuinely care for your audience, you need to focus on retention.
Start by using cohorts to identify improvement areas and scrapping what’s visible at the surface. Get deep into prioritizing the action items by learning exactly what makes users fall in love with your app. What makes them stay, and most importantly, what makes them leave? Segregate your efforts based on the potential impact on retention and the resources required to address them.
Once you are done with this step, move towards developing a robust and agile retention strategy. Remember, the key is always to optimize. You want to avoid deploying a strategy and then waiting for days or weeks to make changes as per the hour. Monitor your cohorts and their actions as often as possible, and make amends in your action plan. This is where the real growth is.
Developing action items after monitoring involves acting on insights at lightning speed. Follow up on your churn rate or CRR. Check the health of your funnels.
Conclusion
If you’re a data-driven marketer or aspire to be, cohort analysis is your guiding star. It’s a framework for goal setting, unfolding insights, setting metrics, and starting strategic conversations.
Many WebEngage customers have deployed campaigns for subscription, feature adoption, app rating, user onboarding, & a plethora of other scenarios after extracting insights from their cohort.
Cohort Analysis empowers marketing teams with insights and strengthens their hypothesis about what should be your next big move. Make Cohort Analysis your go-to option every time you’re planning a customer-focused campaign.
Businesses struggle to thrive as they focus only on acquisition (influx of users) and ignore retention (sustaining those who have joined).
Ready to take your customer retention campaigns to the next level? Request a demo today to learn more about cohorts and how they can help you build effective retention campaigns.


 Diksha Dwivedi
 Ananya Nigam
 Amit Shinde
 Prakhya Nair
 Harshita Lal