


Starting an online store is exciting. But when it comes to e-Commerce metrics, the excitement dip is real!
The potential of the e-Commerce industry is second to none. This industry is currently valued at around $6 trillion. And in just three years from now, it is expected to grow by another 35% in market share — a valuation of over $8.1 trillion. That’s a magnificent jump.
But like every story, this one also proves that success is not without its challenges. Because the reason behind this rapid growth of the e-Commerce industry is growing competition.
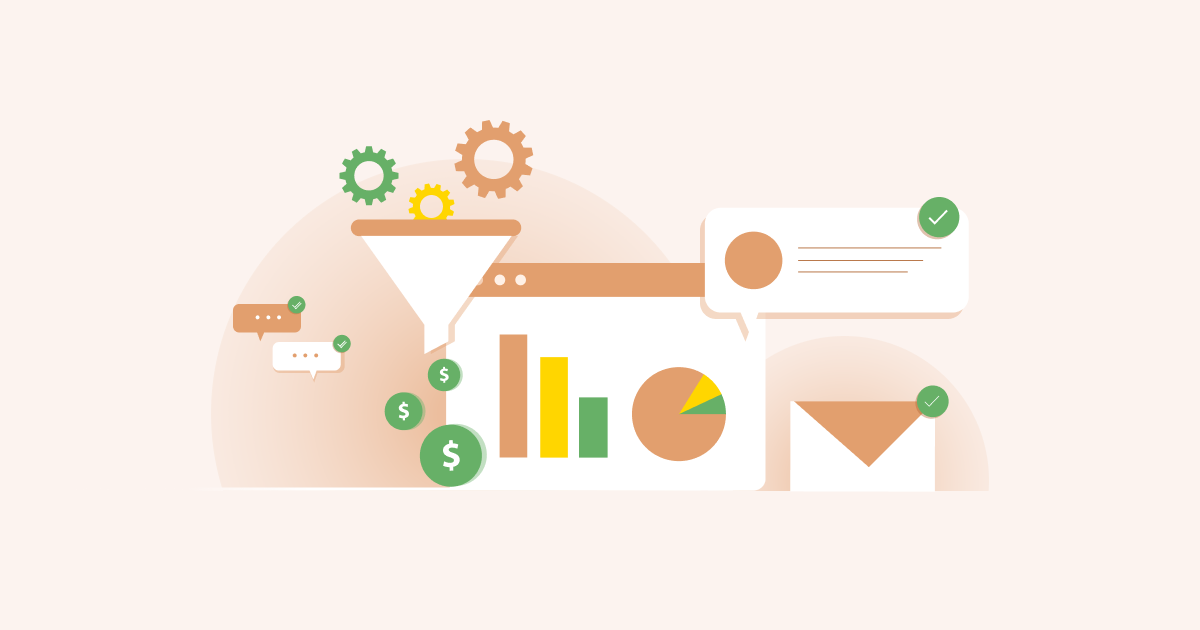
The best solution for brands to succeed in this highly competitive market is leveraging data.
In this blog, we’ve listed some key e-Commerce metrics that businesses must track this year. We’ve also mentioned how these e-Commerce KPIs can help you rise above the competition and streamline your path to success.
Without further ado, let’s dive right in!
Subscribe to our newsletter to stay updated on the latest in B2B marketing
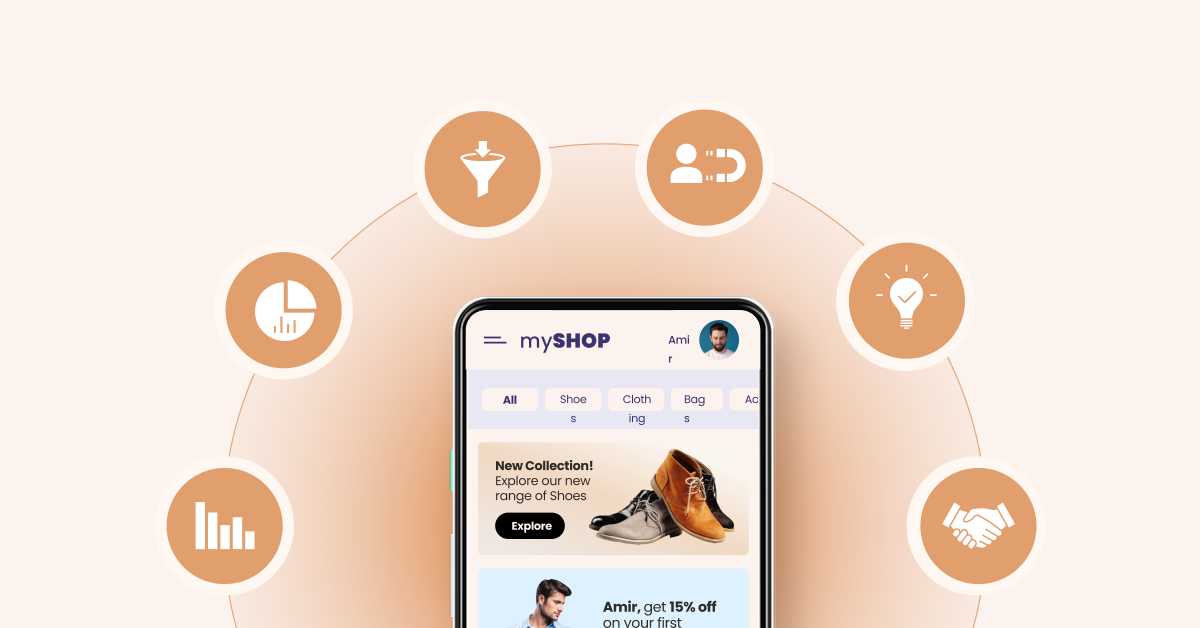
Top 10 e-Commerce Metrics to Track in 2023
If you’re spending $100 per ad click for a product that generates an average customer lifetime value of $50, you either have some weird long-term vision, or your logic is just wrong. And with the current competitive state of the industry, businesses can’t afford any of these two (logic and vision) to be wrong.
But to get both the logic and vision right, tracking the right e-Commerce metrics becomes vital. Here are some we recommend:
1. Sales Conversion Rate per Channel
The sales conversion rate is the percentage of people who purchase from your e-Commerce store out of the total number of visitors.
Let’s say you captured 100 user sessions and got 20 sales. In this case, the sales conversion rate would be 20%.
How to Calculate Sales Conversion Rate?
Sales Conversion Rate = (Number of Sales / Total Number of Visitors) x 100
It’s essential to closely monitor the sales conversion rate to correctly determine the traffic needed on the e-Commerce store to hit your sales goals.
Many e-Commerce businesses start panicking when they calculate the conversion rate and find it low. To give you the right perspective, having a conversion rate of over 5% puts you in the top 25% bracket of e-Commerce companies.
The average e-Commerce conversion rate is just over 3.5%, which should never be your benchmark. If you want to scale your e-Commerce brand, your focus should be on what the top 10% of e-Commerce brands do to have an average conversion rate of 11.45%.
The sales conversion rate is not limited to giving insights about the required traffic to reach a sales target. This metric can be far more valuable if collected for every channel you use. It can help you determine what’s working for you and what needs some tweaks.
For example, if Instagram ads generate the highest conversion rate for you, you should consider putting more effort there instead of some channel that generates little to no sales.
You can also fix and optimize the channels that are not performing as expected. It’ll help you cut losses and maximize growth.
2. Website Traffic per Channel
After you’ve set up tracking for sales conversion rate and optimized it, it’s time to analyze your website traffic.
Website traffic is the number of users that visit your e-Commerce store. It’s measured in ‘visits’ or ‘sessions,’ and it shows the effectiveness of your brand at attracting the audience.
You can easily track and analyze your website traffic using an analytics tool. But while analyzing, don’t just look for the number of visitors. Many additional insights are available that can be far more valuable for you.
You need to look at the traffic coming from different channels. You need to identify the ones driving the most visitors to your store.
Let’s say you get most of your website visitors via Facebook Ads, but the conversion rate is low for Facebook. You should then try to identify what’s stopping the users from Facebook Ads from converting. It can be the un-optimized landing page, overpromised deals, or other reasons.
By fixing the issues, your most visible channel will convert the most, skyrocketing your growth.
3. Opt-in Rate Across Channels
The opt-in rate is the percentage of customers/visitors who agree to receive messages from your brand on different channels.
Download eBook – Learn more from our Omni Channel Customer Engagement: A Winner’s Playbook
The visitors who have opted-in for your messages are noticeably more interested in your brand than ordinary website visitors, even if they haven’t purchased yet. These subscribers care enough about your brand to receive product and sales updates. So sooner or later, they will convert, and not just convert, become repeat customers too.
When you track opt-in, you need to track it across channels — Email, Web Push, WhatsApp, and SMS. This will give you a better idea of the number of people you can reach out to when launching a new campaign, product, or sale.
Here are the average opt-in rate for different channels:
Email: 1.95% WhatsApp: 23% Web Push: 20% SMS: 70%
You can increase your opt-in rate on each of these channels by offering something valuable to the customers in return. For example, if the opt-in rate for Web Push is lower for you than the average rate, you can consider offering discounts to those who subscribe.
The more audience you have in your lists, the more will be your conversion rate. Having more people on the list also means that your CAC will be low, considering many of these customers will be returning for more.
4. Customer Retention Rate
Customer retention rate is defined as the percentage of customers your e-Commerce brand manages to hold for a more extended period.
If the number is high, it shows you’re doing an excellent job with customer service. Lower CRR, on the other hand, means that customers are either unsatisfied with your product quality or there’s something wrong with the post-purchase experience.
How to calculate the customer retention rate?
To calculate the CRR, you need three values:
- Total number of initial customers
- Total number of final customers
- The total number of new customers added between period of I and F
Then put these values in the following formula, and you have your CRR:
CRR = [(Final Customers – New Customers) / Initial Customers] x 100
The average CRR in the e-Commerce industry is 30%. Your goal should be to reach this point first, then breach it and go higher.
It’s essential to keep this metric intact because it has been found that selling to new customers costs 5-10 times more than existing ones. And returning customers spend 67% more than them!
5. Customer Lifetime Value
Customer lifetime value represents the total amount of money that a customer is expected to spend on your products in their lifetime as your customer.
For example, if an ideal customer spends $50 on your store 5-6 times, then the CLV of that customer would be $200-300.
One of the biggest reasons a lot of e-Commerce businesses die is that there’s a huge negative gap between the customer acquisition cost and their lifetime value. If your business is not yet generating repeat revenue, you should not be spending more than the lifetime value to acquire them.
If you’re spending $100 on acquiring a customer, you need to have a plan to get at least that back from the customer. You can start by increasing the average order value and fostering loyalty among customers to bring repeat purchases.
6. Average Order Value
As the name suggests, the average order value is the average amount of each purchase made on your store.
It is pretty simple to calculate. Just divide the total value of purchases made in your store by the total number of carts.
Let’s say you generated $1200 from 30 ordered carts. The average order value will be $40.
By tracking the AOV, you can set better future goals and figure out how to get people to spend more on your store.
Many marketers consider average order value one of the most valuable e-Commerce metrics because you don’t have to spend money to increase your total revenue.
Ego, one of Pakistan’s fastest-growing fashion brands, leveraged WebEngage’s user journey to cross-sell relevant products. This cross-selling helped them increase their average order value by over 12%.
Download Impact Story- Learn how EGO Boost Its Average Order Value by Over 12%
Other than cross-selling, you can also upsell complementary items to improve the usability of primary purchases. You can also set a free-delivery threshold to psychologically nudge customers to purchase extra items from your store.

7. Customer Churn Rate
The e-Commerce customer churn rate represents the number of customers that stop buying from your brand over a defined period.
How to calculate the customer churn rate?
Customer Churn Rate = (Customers lost in a specific period / Total customers in that period) x 100
Two types of churn rates affect the growth of an e-Commerce brand — voluntary churn and involuntary churn.
Voluntary churn is when a customer decides that they no longer need your products. This could be due to a bad experience, but the major reason why it happens is that they just no longer need the product. For example, if you’re selling baby products, a customer will only purchase them for as long as their child is still a baby.
On the other hand, involuntary churn happens when something unexpected happens during the purchase cycle, like a payment failure that causes the purchase to fall through.
While calculating the churn rate for an e-Commerce business, it’s essential to consider both parameters.
Moreover, it’s also essential to keep in mind that customer churn is inevitable for e-Commerce brands. Irrespective of how well-optimized your service is or how great your product is, there will always be customers who will stop buying.
Therefore, instead of making the churn rate zero, you should ensure that it doesn’t exceed your growth rate because the churn rate is inversely proportional to the retention rate. The higher it goes, the less you retain, which affects profitability.
If loyalty is essential for your e-Commerce brand, which is a must, you need to keep a close eye on the customer churn rate.
8. Customer Acquisition Cost per Channel
Customer Acquisition Cost (CAC) is one of the most critical metrics for e-Commerce brands. It shows the cost to acquire one customer, telling you how much you need to earn per customer to make your e-Commerce brand profitable.
How to calculate the CAC?
CAC = Total marketing and sales expenses / Number of customers acquired
If it takes you $30 to acquire one new customer, but they only make a purchase of $25 from you in their lifetime. Is it worth acquiring them with the same strategy? Not if you want to stay profitable.
The average CAC for retail and consumer goods is $10 and $22, respectively. You should ensure that your CAC is below this benchmark from the get go.
Moreover, calculating the CAC per channel is a great way to identify the most economical channel for acquiring customers. When your acquisition cost is low, you can spend more to foster loyalty in customers and increase your revenue.
Here are some tips to acquire customers at a better price:
- Optimize your marketing and advertising strategy to spend less to acquire the same number of customers.
- Work on conversion rate optimization.
- Increase your efforts in organic marketing like SEO and social media.
- Run referral programs to bring more customers for little to no cost.
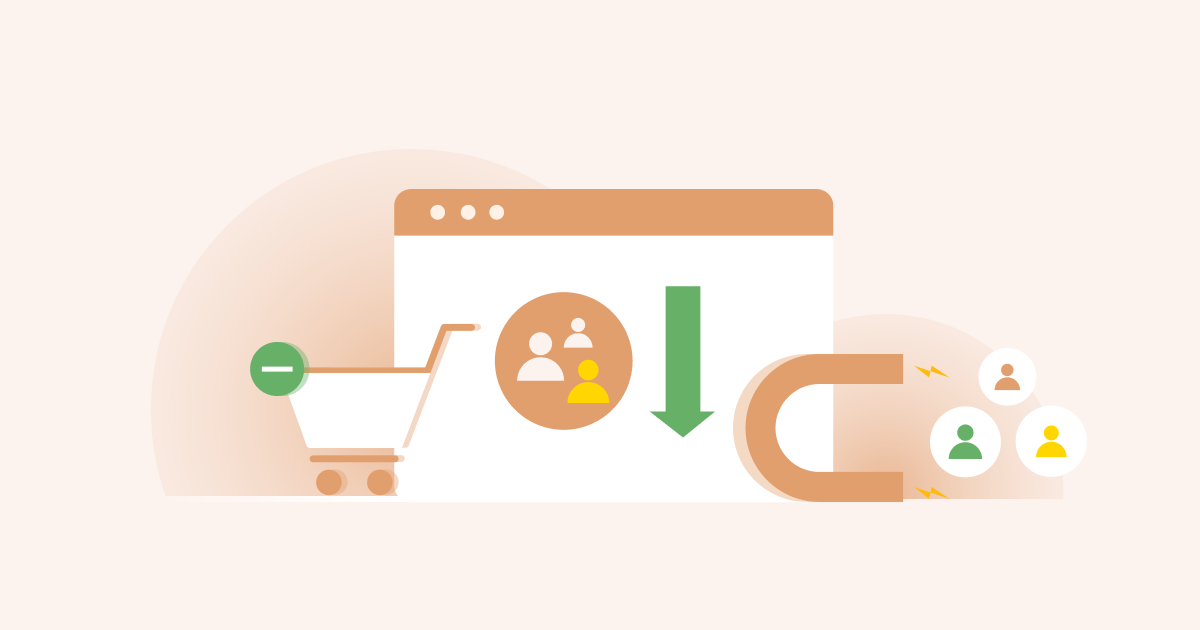
9. Cart Abandonment and Recovery Rate
One of the biggest challenges for e-Commerce businesses is cart abandonment. It occurs when a potential customer adds items to their cart but fails to complete the purchase. This can happen for various reasons, such as high shipping costs, a complicated checkout process, or simply a change of mind.
The cart abandonment rate is the percentage of customers who abandon their cart without making a purchase.
How to Calculate Cart Abandonment Rate?
Cart Abandonment Rate = (Number of Carts Abandoned / Number of Carts Created) x 100
On the other hand, the cart recovery rate measures how many customers who abandoned their carts were brought back to complete the purchase.
How to Calculate Cart Recovery Rate?
Cart Recovery Rate = (Number of Recovered Carts / Number of Abandoned Carts) x 100
Cart abandonment and recovery rates are vital e-Commerce metrics because they give insight into the effectiveness of the checkout process and overall customer experience. High cart abandonment rates can indicate issues with the checkout process or a lack of trust in the brand.
To bring down the cart abandonment rates, businesses should simplify the checkout process, remove any unexpected costs or fees, and offer multiple payment options. They can also send follow-up emails to remind customers about their abandoned carts and offer discounts or incentives to encourage them to complete the purchase.
e-Commerce brands can use cart recovery tools or send personalized follow-up emails with relevant product recommendations and incentives to improve the cart recovery rate. They can also offer free shipping or other promotions to incentivize customers to complete their purchases.
10. Net Promoter Score (NPS)
Net Promoter Score (NPS) is an e-Commerce metric that measures customer loyalty and satisfaction.
It asks customers how likely they are to recommend your brand to a friend or colleague on a scale of 0 to 10. Based on their responses, customers are classified into three categories: detractors (0-6), passives (7-8), and promoters (9-10).
The NPS is calculated by subtracting the percentage of detractors from the percentage of promoters. The result ranges from -100 to 100, where a high score indicates a significant number of satisfied customers are likely to promote your brand.
NPS helps you understand how your customers perceive your brand and how likely they are to refer others to your business. By tracking your NPS over time, you can monitor changes in customer sentiment and identify areas where you need to improve.
To improve your NPS, focusing on providing exceptional customer experiences is essential. This includes delivering high-quality products, offering excellent customer service, and resolving issues quickly and effectively. You can also offer incentives for customers to refer their friends and family to your brand.
Moreover, it’s also important to remember that NPS is just one metric and should be used in conjunction with other metrics to gain a complete picture of your e-Commerce business’s performance.
Conclusion – Don’t skip on these e-Commerce metrics!
As the importance of omnichannel strategies continues to grow, businesses must adapt quickly to stay ahead of the competition.
By tracking the key metrics we’ve listed, e-Commerce brands can gain valuable insights into their performance and make data-driven decisions to improve their bottom line.
To keep track of these e-Commerce metrics, it’s crucial to analyze and monitor them regularly. Weekly or biweekly tracking can help you stay on top of any changes in performance and take timely action.

One way to streamline this process is by having all your data in one place. WebEngage is a platform that can help e-Commerce businesses collect and analyze customer data from multiple channels, allowing you to make informed decisions and optimize your strategy through an easy-to-understand e-Commerce metrics dashboard.
With the right tools and a data-driven approach, your business can thrive in today’s competitive e-Commerce landscape.
Deliver Meaningful Messages For Your Business Today, Request A Demo Now

 Ajit Singh
 Prakhya Nair
 Harshita Lal


 Niket Raja