


Introduction
If you’re looking to start or expand your online business, understanding web analytics can be a valuable tool.
You can learn a lot about your website’s visitors from web analytics, including how they spend time on your website and what their preferences are. By tracking metrics like page visits, unique visitors, bounce rate, and conversion rate, you can optimize your website design, content strategy, and marketing efforts.
In this guide, we’ll explore the key metrics and tools of web analytics and show you how to use them effectively. We’ll also explore real-world examples of businesses that used web analytics to solve business problems and drive growth.
Whether you’re a newbie business owner or looking to scale up your online business, this guide addresses all you need to know about web analytics. Let’s dive in.
What are web analytics, and why do they matter?
Web analytics involve collecting, examining, analyzing, and displaying information on website visitors and their behavior. This helps website owners understand how users interact with their website and what could be tweaked to improve user experience.
Let’s suppose you own a website that sells scented candles. By using web analytics, you can learn about things like:
- The number of visitors on your website
- The locations they’re coming from (country, state, or city)
- The pages they keep returning to
- The time they spend on each page
- The way they engage with your pages (for example, whether they put something in their shopping cart or leave your site when they face an image-heavy page that’s taking longer to load)
- Whether or not they end up making a purchase
This information could help you in many ways. For example:
- If a slow-loading page turns buyers away, you could redesign it to improve site speed.
- If you notice sales increasing during festivals, you could create personalized and contextualized web experiences to boost engagement and sales. Some ways you can do this are by:
- Creating a festival-specific collection showcasing candles related to the festival.
- Displaying pop-ups or notifications with offers on festival-themed scented candles based on your visitors’ behavior and interests. Suppose many people are leaving without buying anything right at the checkout stage. In that case, you might need to streamline the checkout process or add more payment options to encourage buyers.
Web analytics are crucial processes that help online business owners understand user behaviors on their websites. With the help of this information, website owners can improve their site designs, offer a better user experience, and grow their businesses.
Mastering the Web Analytics Process
Navigating web analytics can feel overwhelming, but let’s break it down into simple, manageable steps. 1. Define Your Goals Know what you want to achieve:
- More traffic?
- Higher conversion rates?
- Better engagement?
Clear goals help you focus on the right metrics. 2. Identify Key Metrics Pinpoint KPIs that align with your goals:
- Traffic: Page views, sessions, unique visitors.
- Engagement: Bounce rates, session duration, pages per session.
- Conversions: Conversion rates, goal completions, sales figures.
3. Implement Tracking Tools Set up tools like Google Analytics:
- Account setup: Follow the setup wizard.
- Install tracking code: Add to your website’s HTML to collect data.
4. Collect and Monitor Data Gather and observe data:
- Initial collection: Let your tool gather data for a baseline.
- Regular monitoring: Check analytics regularly for trends or issues. 5. Analyze Data Dive into the numbers: Identify trends: Look for patterns. Compare metrics: See how different metrics relate. 6. Generate Insights Turn data into actionable insights:
- User behavior: Why are users leaving?
- Content performance: What’s working well?
- 7. Take Action Implement changes based on insights:
- Optimize pages: Improve load times, and enhance UX.
- Adjust strategies: Focus on what’s working.
- 8. Review and Repeat Make it a continuous process:
- Monthly reviews: Regularly go over your data.
- Continuous improvement: Refine strategies based on new data.
- And that’s it! Follow these web analytics insights and drive your business forward.
Important metrics of web analytics
First, let’s understand some key metrics that web analytics help measure.
Page visits (sessions) and page views
Page visits track the traffic to a website within a given time frame. Page visits, also known as sessions, measure how many times a user visited your website, including all pageviews and interactions within a specific period. A session starts when visitors enter your website and ends when they leave or become inactive after a specified time. A high number of page visits from disinterested buyers might not be helpful. In contrast, fewer visits from high-intent buyers can indicate the page’s effectiveness in driving conversions.
Page views are the number of views a webpage gets (or the number of times it loads or reloads) over a given period.
Let’s see how these two are different.
Imagine a visitor coming to a website and viewing five different pages during their visit. This would count as one page visit (or session) but five page views.
Also, page visits occur when visitors land on a webpage from an external source (like a search engine). But page views occur when a single user loads or reloads a webpage, regardless of whether they came from an external source or were already on your website.
Unique visitors
Unique visitors are those who have visited a website during a given time, regardless of how many times they’ve visited. Page views track the total number of views which might include repeat visits by the same person. Unique visitors metric shows the actual number of visitors to the website.
Let’s say there is a website called “Something.com,” and we want to analyze its visitor data.
During the month of April 2023, Something.com had 10,000 unique visitors and 30,000 page views.
This means that there were 10,000 unique individuals who visited Something.com at least once during April 2023. It doesn’t matter if they visited the website multiple times, they are counted as a unique visitor only once.
On the other hand, the total number of page views is 30,000. This includes all the visits to the website, whether they are by unique visitors or repeat visits by the same person. So, if someone visited Something.com eleven times during April 2023, it would contribute eleven page views to the total count.
Sessions
A session measures a user’s time on a website, starting when they first land on it and ending when they leave or become inactive for a specified period (usually 30 minutes). Users may view multiple pages during a session, take various actions, or engage with different website elements. The number of sessions can be a valuable metric for understanding how visitors interact with a website over time.
Bounce rate
Bounce rate gives the percentage of visitors who leave after viewing only one webpage and taking no further action.
Time on page
Time on page indicates how long a user spends on a specific website before moving to another page or leaving the site. You can measure it by deducting the time when the user first accessed the page from when they navigated to another page or closed the website.
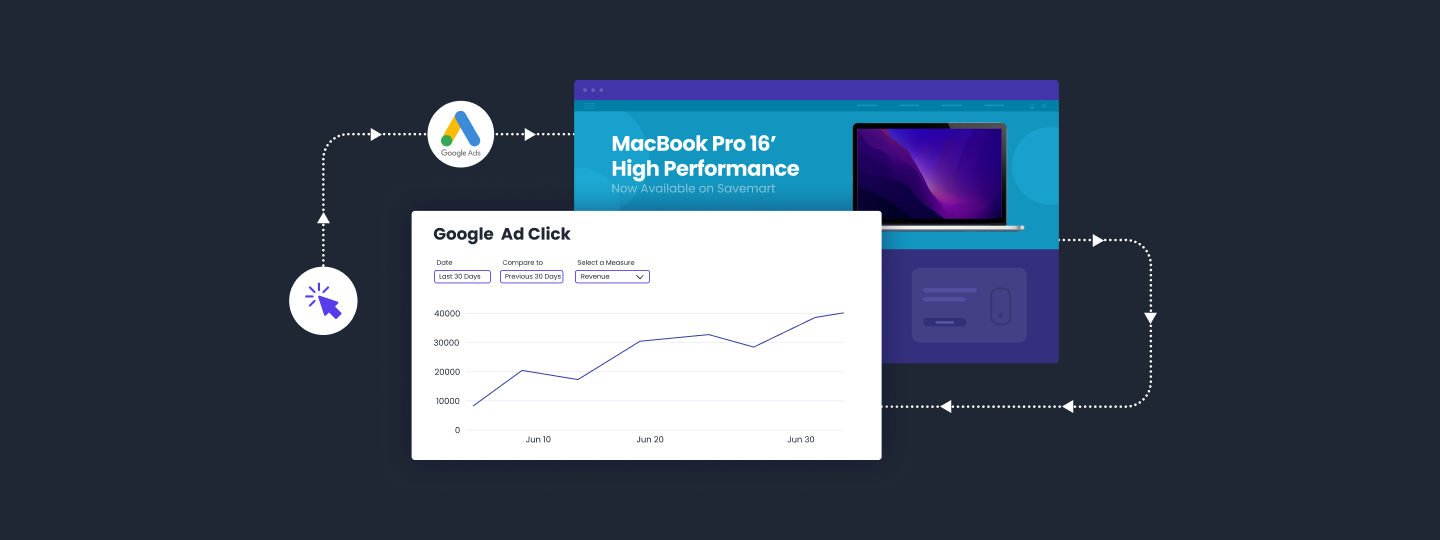
Click-through rate (CTR)
CTR calculates the percentage of users who click on a call-to-action (CTA) link compared to the total number who view a page, email, or advertisement. This tells you how engaging or effective your marketing campaign is.
Conversion rate
Conversion rate calculated the percentage of users who take a specific action or complete a desired goal, such as purchasing something, downloading an eBook, or subscribing to an email newsletter. For example, if a website had 2,000 visitors and 500 made a purchase, the conversion rate would be 25%.
Exit rate
Exit rate denotes the percentage of visitors who leave a website or web page after viewing it. This differs from bounce rate, which considers only those who leave a website after viewing just one page. Exit rate considers all pages a user may have viewed before leaving.
Exit rate is a helpful metric for identifying potential problem areas on a website, such as pages that may be causing users to lose interest or become frustrated.
Remember, pages like the checkout page will naturally have high exit rates. So a high exit rate isn’t always problematic unless it’s happening on a landing page or a product page.
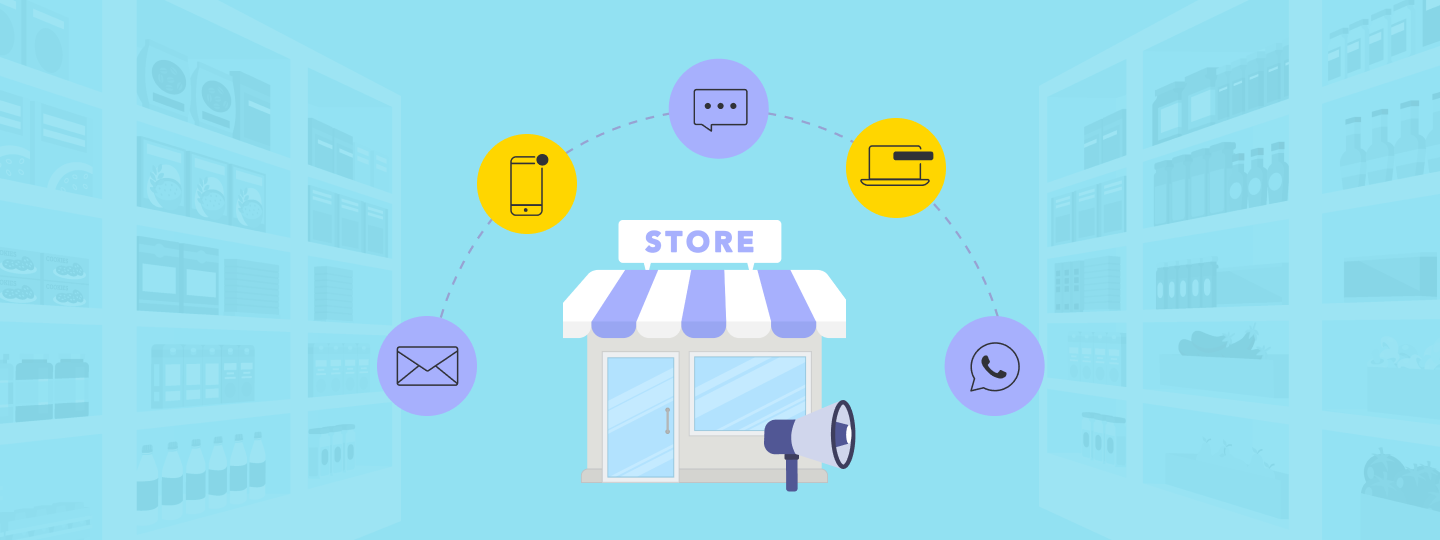
Traffic sources
Traffic sources are the channels through which users find and access your website, such as social media platforms, search engine result pages, and more.
For example, if you’re running an email marketing campaign, the CTA can direct users to a specific page on your website where you want them to take action, such as purchasing a product or downloading a white paper.
If your visitors are referral traffic, they might first land on an article or blog post on your site whose link was shared by another website.
Return on investment (ROI)
ROI is a financial measurement of the profitability of your website, which compares the cost of running your website or marketing campaigns to the revenue generated.
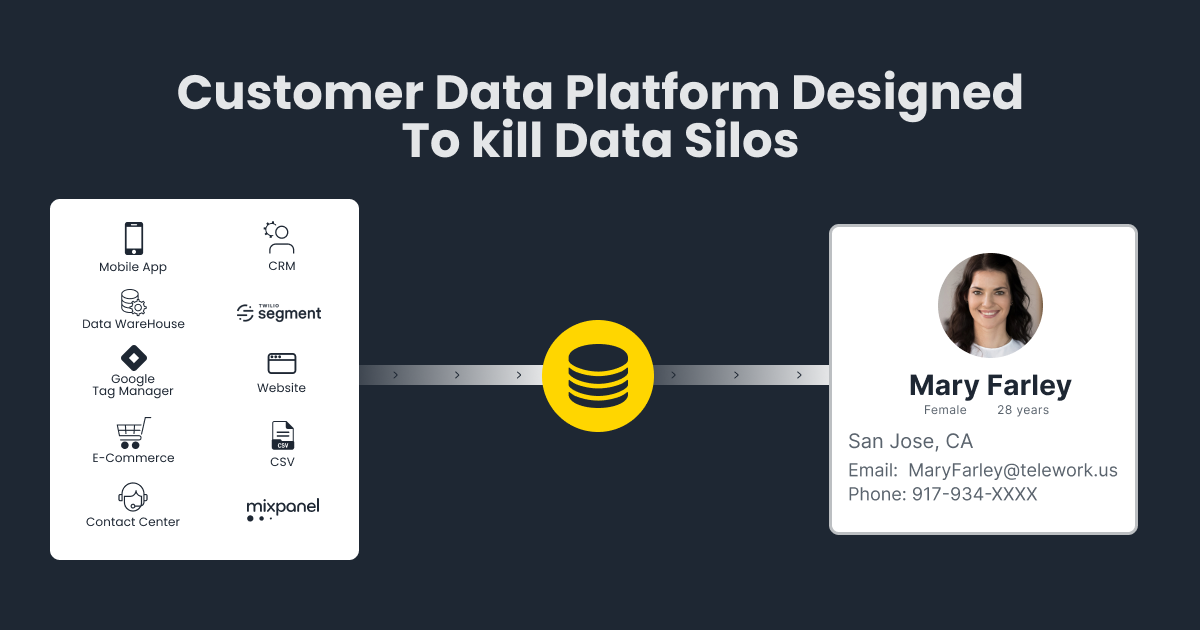
WebEngage’s Customer Data Platform (CDP) helps you track all of these key metrics across different sources, such as websites, mobile apps, and data warehouses, in one place. This way, you can obtain a complete and unified view of your customers. The insights you gain from this help you to build more personalized and targeted campaigns.
Common Issues with Web Analytics
Navigating web analytics can sometimes be tricky, with a few common issues cropping up regularly. Here’s a quick guide to the most prevalent problems and how to address them effectively.1. Inaccurate Data
One of the most frustrating issues in web analytics is dealing with inaccurate data. This can result from incorrect or multiple tracking codes on your website, or an influx of bot traffic skewing your metrics. To combat this, ensure your tracking codes are correctly placed on every page of your site and regularly audit your analytics setup to filter out bot traffic and verify the accuracy of your data.2. Data Overload
Having access to a vast amount of data can be overwhelming and often leads to analysis paralysis. This issue can be mitigated by focusing on key metrics that align with your business goals. For instance, Google Analytics offers custom dashboards, which can help highlight only the most relevant data, making it easier to derive actionable insights. As of 2023, over 28 million websites use Google Analytics to manage their data.3. Misinterpreting Data
Misinterpreting data is a common pitfall in web analytics. Without proper context, data can be misleading. For example, a high bounce rate might initially seem negative, but if users are quickly finding the information they need, it could be a sign of efficiency. Always compare data over time to identify trends and avoid jumping to conclusions based on isolated numbers. A report by the Content Marketing Institute found that 50% of marketers struggle with interpreting analytics data correctly.4. Tracking Gaps
Tracking gaps can lead to missing important data, which can significantly hinder your ability to make informed decisions. Regularly conducting audits to ensure all pages and significant interactions are being tracked is crucial. Event tracking, such as form submissions or button clicks, should be thoroughly implemented to capture all relevant user actions. According to a survey by HubSpot, 70% of marketers feel that their companies are not collecting enough data to support their marketing strategies effectively. By addressing these common issues, you can ensure your web analytics setup is accurate, manageable, and truly beneficial for your business.
What kind of problems do web analytics help solve?
Here are some ways in which web analytics can boost your business growth. The accompanying impact stories show how they can be put into practice.
User behavior tracking
Web analytics help track your visitors and provide insights about their behavior. Suppose a user visits a website and clicks on a product page. Web analytics tools monitor how users interact with the product page, including metrics like the length of time they spend on the page, whether they added the product to their shopping cart, and if they ultimately made a purchase.
The software also tracks the user’s behavior on other pages, such as the homepage and checkout page.
The user’s behavior data is aggregated and analyzed to understand patterns like which products are popular, what pages have high bounce rates, and where users tend to drop off in the checkout process. This information can help you tailor your website for a better user experience and higher conversion rates. According to Forrester, companies that make data-driven website changes are three times more likely to improve customer experience (CX) than companies that don’t consider data analytics.
Let’s see this in action.
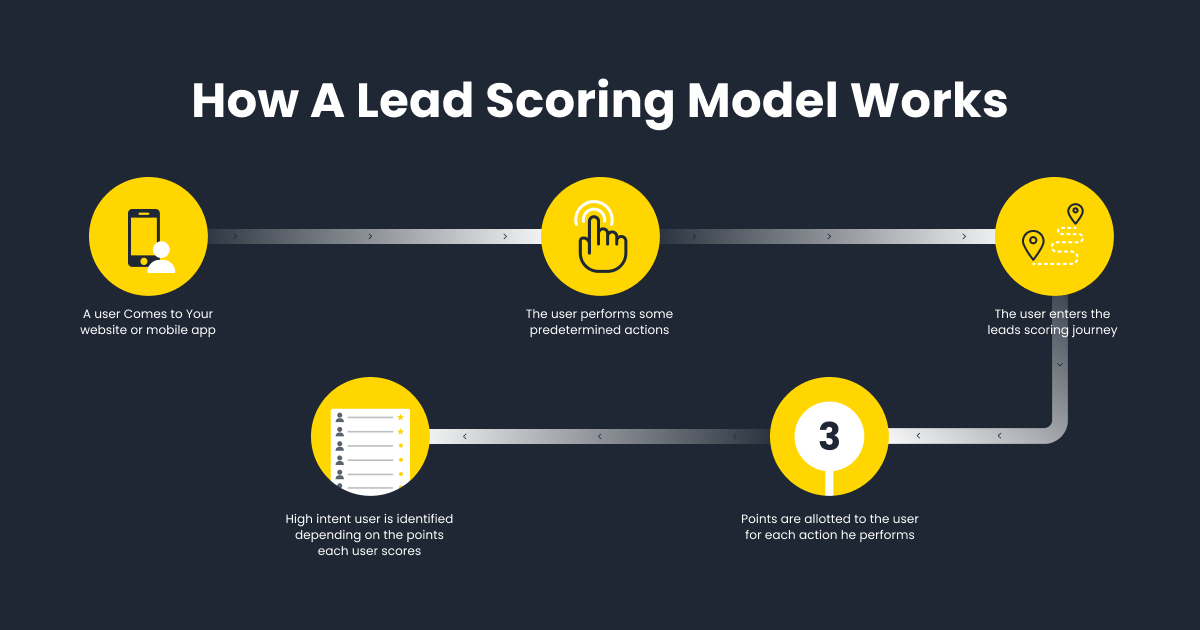
TravelTriangle, India’s biggest OTA marketplace, wanted to investigate why people visited their web pages or mobile app but left without booking a trip. With the help of the Lead Scoring model designed by WebEngage, TravelTriangle could assign scores to its visitors. A high lead score implied high intent users. Once the user segments were defined, TravelTriangle targeted the high-intent users via hyper-personalized communication and cross-channel engagements. As a result, the drop-offs on the travel destination landing pages were reduced by 10%, and the company’s remarketing cost declined by 30%.
Website design and content strategy
You can use web analytics to identify areas for improvement in your website’s design and content. Using these insights, you can create a more user-friendly website that offers content tailored to your target audience’s preferences. This will help boost your engagement and conversions.
For example, a business might use web analytics to identify the traffic sources to its website and the most popular pages among its visitors. The company could optimize its website design and content strategy with this information to improve engagement and conversion rates.
Let’s see this in action.
Happilo, an Indian gourmet health food brand, faced trouble retaining its customers due to a lack of personalized and relevant website content.
Happilo deployed WebEngage’s in-line personalization tool, which helps create a customized website experience for each user based on their behavior and attributes. You don’t need any coding experience to use the in-line personalization tool.
As a result of implementing in-line personalization, Happilo could achieve a 15% growth in conversion rates through repeat purchases and a staggering 286% uplift in conversion by targeting cart abandoners.

Marketing efforts
Businesses can use web analytics to track the performance of their digital marketing and advertising campaigns and choose the best channels for reaching their target audience.
Let’s see how this is done.Scripbox, India’s leading digital wealth manager, needed help optimizing its marketing efforts to enhance acquisitions and retention. With WebEngage’s Journey Designer and analytics platform, the company could segment its customer base based on domestic and NRI residents. Then they targeted the segments with more personalized communication using WebEngage’s dashboard features like ‘Send Intelligently‘ and ‘A/B testing.’ WebEngage’s web analytics tools also empowered Scripbox to measure and rank its marketing campaigns’ efforts and optimize the most effective ones.
As a result, the company witnessed a 3X growth in user engagement, a 25-30% growth in email open rates, and frequency capping in marketing campaigns leading to a 25% decrease in unsubscribe rate.

How to leverage Web Analytics to create high-impact strategies that drive business growth?
Define goals and objectives
To use web analytics insights effectively, you must first define the goals you’re trying to achieve. For that, you first need to determine your overall business objectives. Are you trying to boost sales or improve engagement? Identifying your goals will help you focus your efforts and ensure that you’re tracking the right metrics.
Make the goals as precise as possible. So instead of setting a goal like increasing web traffic, set an objective like ‘increasing website traffic by 20% in the next four months.’ All your goals should be specific, measurable, achievable, relevant, and time-bound (SMART).
Track the right metrics
Once you’ve identified your objectives, it’s time to determine the Key Performance Indicators (KPIs) that help measure the progress toward your goals. Let’s assume you want to boost sales. In that case, your KPIs could be conversion rates, cart abandonment rates, and revenue per user.
Choose the right tools
Select the web analytics tools that will help you collect the data you need to measure and analyze your chosen metrics most efficiently. Analytics tools can help you track user behavior on your website, including which pages users visit, their time on a page, and their actions. Google Analytics is a popular tool with many features, but other options are also available.
WebEngage has some advanced and sophisticated analytics tools like Funnels, Paths, and Live Analytics that help you in cases like:
- Visualizing how customers are engaging with your brand
- Tailoring your sales funnel to suit customer behavior
- Getting real-time insights on your marketing campaigns
- Encouraging customers to return to your eCommerce site
- Understanding the reasons for customer drop-offs
Analyze the data
Once you’ve installed the right analytics tools and tracked your chosen metrics, you must analyze the data. Look for patterns, trends, and anomalies. Understand which areas of your website are engaging users (or causing them to leave). This knowledge can inform your content and design decisions.
For example, Clovia, a leading full-stack lingerie brand in India, used WebEngage’s Funnels to analyze user behaviors and customer drop-offs on its websites and apps. A checkout funnel was created for high-intent users to observe their behavior patterns at different times.Identify traffic sources
Understanding how users find your website is crucial for building effective marketing strategies. Analytics tools can reveal which channels (e.g., search engines, social media, email) drive traffic and which generate the most conversions.
User segmentation
Segmenting users based on demographics, behavior, or other factors can help you identify patterns and trends that might not be immediately visible when looking at aggregate data. This information can inform your targeting strategies and help you create more effective messaging and campaigns.
Use A/B testing
Analytics tools can help you test different variations of your website and marketing campaigns to identify the highest-performing versions. You can tweak your website and campaigns accordingly.
Make data-driven decisions
Based on your analysis, decide how to improve the performance of your website. Adjust your website design, content, or marketing strategies to achieve your goals.
In continuation to our last example, Clovia analyzed the data it collected. Using WebEngage’s Journey Designer, the company created a personalized multi-channel journey that encouraged customers to complete the checkout process. Using web analytics tools, Clovia determined the best time to reach out to cart abandoners. As a result, it experienced an impressive 85% growth in its overall revenue.
Continuously monitor and refine
Your job doesn’t end when you reach your goals. Keeping track of your website metrics and making tweaks to your strategy according to the insights received is an ongoing process.
Over time, your business metrics will change. But one thing will remain true: you will always need to track your website’s performance and make necessary adjustments with the help of web analytics tools.Something to keep in mind
There are certain instances, like dark social, where web analytics might not give you the most accurate insights.
Dark social refers to social sharing and online referrals that occur through private messaging platforms, email, or other non-public channels, making it difficult for marketers and analysts to track and measure. In other words, it is the sharing of content or links that take place outside of public social networks without identifying the source.
Imagine sharing a link with your friend via private messaging through WhatsApp or Facebook Messenger. In these cases, the referrer information is often lost. Then when your friend clicks on a shared link and visits a website, the source of the traffic appears as “direct” instead of being attributed to the specific sharing channel.
Web analytics tools can provide some insights and help shed light on dark social to a certain extent, but they are not designed to fully capture and track it.
To gain a more comprehensive understanding of dark social, you might need to employ alternative methods, such as surveys, user interviews, or social listening tools, to gather data and insights from users themselves about their sharing behaviors.
Web Analytics Best Practices
Implementing web analytics effectively requires following some best practices to ensure you’re getting the most accurate and useful data. Here’s a guide to some essential best practices and how they can benefit your business. 1. Set Clear Goals and KPIs The foundation of effective web analytics is setting clear, actionable goals and key performance indicators (KPIs). Whether you aim to increase website traffic, boost conversion rates, or enhance user engagement, defining your objectives helps in focusing on the metrics that matter. According to a survey by HubSpot, companies that set specific goals are 377% more likely to report success. 2. Use Multiple Tools for Comprehensive Insights Relying on a single analytics tool might not give you a full picture. Combining different tools can provide a more comprehensive view of your data. For example, pairing Google Analytics with tools like Hotjar for heatmaps or SEMrush for SEO analytics can offer deeper insights. As of 2023, over 60% of marketers use multiple analytics tools to gain better insights. 3. Regularly Review and Clean Your Data Regularly reviewing and cleaning your data is crucial to maintain its accuracy. This involves filtering out spam and bot traffic, correcting tracking errors, and ensuring that all relevant data points are captured accurately. 4. Segment Your Audience Audience segmentation allows for more targeted analysis and web analytics insights. By breaking down your audience into segments such as new vs. returning visitors, geographic location, or user behavior, you can tailor your strategies more effectively. 5. Implement Event Tracking and Conversion Funnels Tracking specific events and setting up conversion funnels helps in understanding user interactions and identifying potential drop-off points. Event tracking can include actions like form submissions, button clicks, or video plays. Conversion funnels, on the other hand, help visualize the path users take towards completing a goal, making it easier to spot and address issues. By following these best practices, you can ensure that your web analytics strategies are more effective, providing valuable insights to drive your business forward.Final Thoughts
If you dream of growing your online business, there’s no doubt that web analytics are crucial. Without understanding your website traffic and user behavior, making informed decisions about optimizing your website design and marketing strategies is almost impossible. But don’t worry. You need not do everything by yourself.
WebEngage is here to help you harness the power of data-driven decision-making. Our advanced analytics features are designed to help you gain deep insights so you can make informed decisions that drive growth and boost conversions. With tools like funnels, paths, cohorts, and live analytics, you’ll have all the information you need to customize your website and marketing campaigns for maximum impact.
Need more proof? Check out our Impact Stories. Our analytics’ capabilities have helped businesses like yours achieve remarkable results. We’re confident we can help you. Ready to take the leap? Head to our website to book a demo today.FAQs
How important is web analytics?
Web analytics is crucial for understanding how visitors interact with your website. It provides insights into user behavior, helping you make informed decisions to improve user experience, increase engagement, and boost conversions. By tracking key metrics, you can identify what’s working and what needs improvement, ultimately driving business growth.How do you analyze web analytics?
Analyzing web analytics involves several steps: - Set Clear Goals: Define what you want to achieve (e.g., more traffic, higher conversion rates).
- Identify Key Metrics: Focus on metrics that align with your goals, such as page views, bounce rates, and conversion rates.
- Use Analytics Tools: Utilize tools like Google Analytics, SEMrush, and Hotjar to collect and analyze data.
- Monitor Data Regularly: Keep an eye on your data to spot trends and anomalies.
- Generate Insights: Interpret the data to understand user behavior and identify areas for improvement.
- Take Action: Implement changes based on your insights and monitor the results.
What is an example of web analytics?
An example of web analytics is using Google Analytics to track the performance of a blog post. By examining metrics like page views, average time on page, bounce rate, and traffic sources, you can determine how well the post is engaging readers and driving traffic to your site. For instance, if a post has a high bounce rate, it might indicate that the content isn’t meeting user expectations, prompting a review and potential rewrite of the post to improve engagement.What are the limitations of web analytics?
Web analytics has several limitations: - 1. Incomplete Data: Not all user interactions are tracked, leading to gaps in data.
- 2. Data Quality Issues: Incorrect tracking code placement or bot traffic can result in inaccurate data.
- 3. Interpretation Challenges: Data can be misleading without proper context, leading to incorrect conclusions.
- 4. Privacy Concerns: Collecting user data must comply with privacy regulations like GDPR and CCPA, which can limit the amount of data you can gather.
- 5. Technical Skills Required: Effective analysis often requires a good understanding of the tools and data interpretation skills.
- What are the risks of web analytics? The risks of web analytics include:
- 1. Privacy Violations: Mismanaging user data can lead to privacy breaches and legal issues, especially with regulations like GDPR and CCPA.
- 2. Data Misinterpretation: Incorrectly interpreting data can lead to poor business decisions.
- 3. Over-Reliance on Data: Focusing too much on data can stifle creativity and intuition in decision-making processes.
- 4. Security Risks: Storing and managing large amounts of user data can make your systems a target for cyberattacks.
- Compliance Risks: Failing to comply with data protection laws can result in hefty fines and damage to your reputation.


 Prakhya Nair
 Diksha Dwivedi