


After you’ve published your app on the Google / Apple store, the three things that will occupy the larger chunk of your brain are:
- How to get more people to download your app (which, as you’ll come to know, is not-that-important-a-thing to worry about),
- How to get people to spend more time inside your app (the stickiness quotient), and
- And how to get more people to purchase (or take your other desired actions).
But these are your overarching objectives and there’s no one single parameter to give you inch-perfect insights into them. So, how would you know if these objectives of yours are being met?
For that, you need to keep an eye on the various kinds of ‘Mobile App Metrics’.
So, What Exactly are Mobile App Metrics?
They tell you about the performance of your app and will keep you informed around retention, engagement, conversion and the revenue generation potential of your users.
While keeping track of your app downloads is a good place to start with, Inc. Magazine says this metric can be a little misleading as 80–90% of the apps are used just once & are eventually deleted.
(But we’ve still talked about app downloads, in one of the most important sections below).
Now, before we begin, something worth considering is that out of all the following app metrics, not all of them might be applicable to your business and before you even begin tracking them, it’ll be good to have a prior idea of how should the numbers look for you, for every single metric.
Why is this important?
For the simple reason that 90-second sessions for an investment app are completely fine but the same can’t be said for a music streaming app, which would mean a user did not even listen to one complete song (if you’re from Spotify, I feel you).
It’s paramount to understand which metric is worth mapping for your business and which of them do not affect your bottom line — revenue, conversion or user engagement.

Sahil Deswal
Head - Growth & Marketing, The Times of India, Times InternetToday, the conversation is slowly moving away from digital versus traditional marketing to simply 'growth marketing'. Brands are increasingly being more conscious of ROI driven efforts to propel meaningful growth and hyperlocal personalisation to increase customer engagement, influencing more buy-ins.
We’ve segmented the 20 mobile app metrics (we’ll tell you which are important) into broader buckets of Acquisition, Engagement, Conversion, and App Performance. This will help you understand which exact metric is affecting which of your core Key Performance Indicators (KPI).
Table Of Contents
- App Metrics for Acquisition
- App Metrics for Engagement
- App Metrics for Conversion
- App Performance Metrics
- Vanity Metrics
- Your True North Star App Metric
App Metrics for Acquisition
1. Cost Per Install (CPI) / Cost of Acquiring a Customer (CAC)
Once your app installs shoot up, it’s very easy to sit back and relax, but at some point in time, if not now, you’ll have to account for all the money you spent to get these installs. Basically, the average money you spent for every single download.

Nivesh Jain
Head - Digital Marketing and Growth, Headrush VenturesIn order to make business sense, any app has to deliver a healthy ROI. Start with estimating your costs of building and maintaining the app, along with the CPIs. The key, however, is the time period over which revenues are measured, and this can vary with the nature of your business. For an entertainment app, it could be daily; for a food delivery app, maybe weekly; for an e-commerce app, monthly or even quarterly; and for a medical diagnostic center, perhaps annually.
Now, if the app has been launched recently and you are yet to score stable revenues, focus on loyalty and engagement metrics, especially stickiness and time spent on the app. But always pursue ROI as the primary metric in the long run.
You’d ideally want to keep your CPI low and spend as little as possible in acquiring your users. The moment your CPI rises above your Customer Lifetime Value (CLTV), (we’ll discuss it next) it’s an indication that you’re losing money on every download, or on every customer you bring — not a good sign for your business.
How to calculate CPI?
Total Marketing Cost / Total Acquired Users
For example,
In a month, say you spent Rs 1,00,000 through all your marketing activities (both online and offline) and got 100 new installs, then your CPI becomes Rs 1,000.
Want to know how to keep your CPI at a minimum? Here are 12 tips for reducing your cost of acquisition.
2. Customer Lifetime Value (CLTV)
After acquiring a customer, the next most important app metric for you will be to know how much value they will generate for you, till they’re your customer. Customer Lifetime Value is concerned with determining how much money can you expect to make from your average consumer, till the time they uninstall your app, or in other words, cease to be your customer.
Your CLTV will be an indicator to understand if you’re spending more to acquire your users, which can be a big red flag for your business. In case of which, you need to dedicate substantial efforts toward increasing your CLTV.
How to calculate CLTV?
Average Value of Conversion X Average Number of Conversions over a Time period X Average Customer Life Time
For example,
Let’s say, you’re an e-commerce brand and an average user spends Rs 500 on your platform. Your average user makes 3 purchases in a year and stays, on average, for 2 years with your company. Hence, the CLTV of your consumer is Rs 3,000.
Now compare this number with your acquisition costs to understand if you’re making a loss with every customer that you acquire. Your CLTV should be higher than your CAC.
Take a demo with WebEngage and Learn How WebEngage Can Improve The CLTV Of Your Business
3. Average Revenue Per User (ARPU) & Average Revenue Per Paying User (ARPPU)
The average revenue per user is a very important metric to understand if you’ll reach your monthly revenue targets and if not, then what kind of a gap are you fighting to close. ARPU is basically the amount of revenue your average user generates for you.
If you look at it more closely, ARPU & CLTV seem to be very similar – where ARPU gives you revenue analytics by telling you the average revenue your user generates for you now & CLTV tells you the average revenue your user will generate for you, for the time they’re your customers.
But the difference is not that minor after all. With ARPU, you cannot predict the entire amount of revenue your user will supposedly generate for you in all their lifetime, which is what you need CLTV for. To make future revenue predictions and base your decisions on that.
Reliance Jio is a good case in point in how falling ARPU can be worrying for a business.
How to calculate ARPU?
Lifetime Revenue / No. of Lifetime Users
For example,
In total, users have made 50,000 worth of purchases from your app and you have 100 users. So, your ARPU becomes 500, meaning, on average, each user generates Rs 500 in revenue for you.
You can go further deep into this by calculating ARPPU instead of ARPU. At any point of time, you’ll have a good amount of users who have not done any transactions in your app. While they’re still your customers, but because they’ve not contributed anything to your revenues, you can eliminate this cohort of users to understand the real value your paying users bring to your business, which is what ARPPU helps you with.
How to calculate ARPPU?
Lifetime Revenue / No. of Paying Users
Taking the same example from above, let’s assume that out of 100 total users, your 50,000 worth of revenue has been contributed by only 25 users. In other words, you have 25 paying users. So, your ARPPU becomes Rs 2000 meaning, every paying user, on average, at least spends Rs 2000 on your app.
App Metrics for Engagement
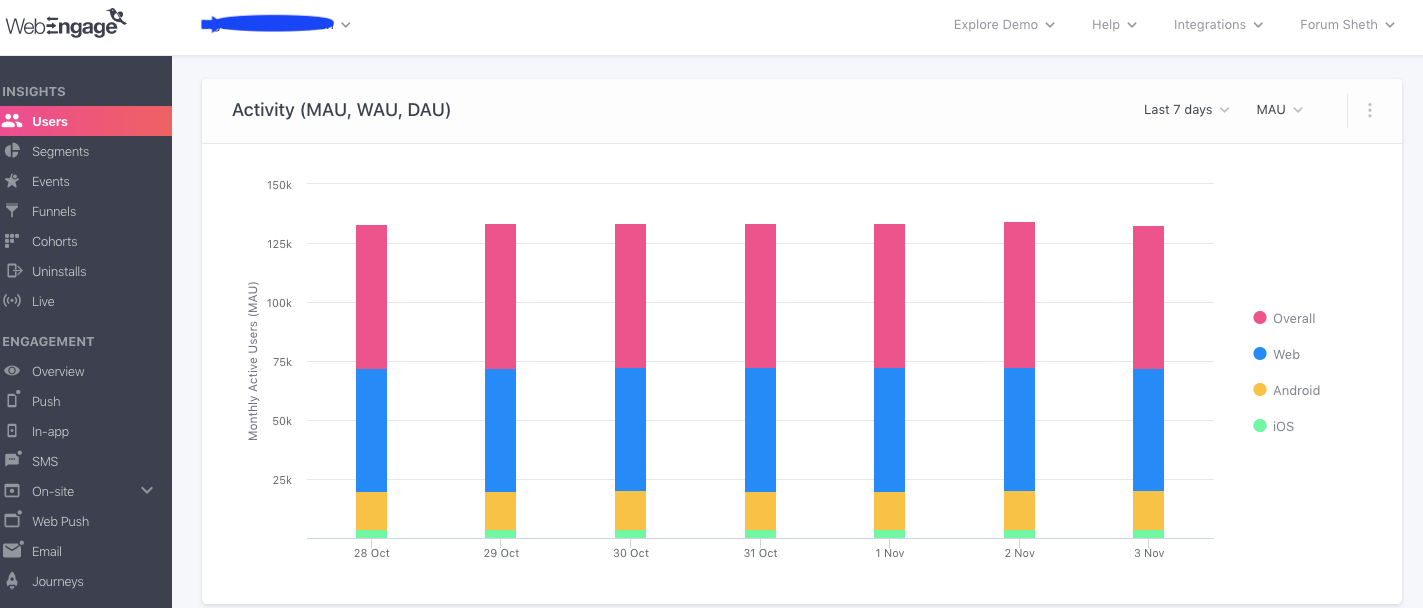
1. Daily Active Users (DAU) & Monthly Active Users (MAU)
Arguably, the most popular terms in the marketing index and arguably the most important metrics to measure user engagement for high growth B2C companies.
Today, when around 28% of the apps get uninstalled within the first 30 days, there’s no guarantee that if someone has installed your app, they’re going to use it as well. Your DAU & MAU mobile app metrics can help you understand how engaging or how useful your app is to the people who download it.
DAU is the measure of the number of unique users on your app daily while MAU tells you about the number of unique users on your app over a 30-day period i.e., a month.
The DAU & MAU numbers should always be on an upward trajectory, otherwise you need to employ tools such as push notifications to bring your customers back. These numbers can also give you data around the day / week your users are most active on your app, which you can use to create limited-time, conversion focused campaigns.
DAU can vary greatly depending on the industry you operate in. For apps like Facebook & Instagram, DAU could probably be the most important KPI, but for someone like a healthcare app, they might not depend on DAUs for measuring their growth trajectories. So figuring out the importance of this metric in correspondence with the industry you operate in, is the foremost thing to do.
For example,
Say, you’re a food delivery platform and majority of your users are active on Sundays – your DAU. You can run promotional campaigns on Sundays, offering direct discounts or incentives to spend more.
Specifically in case of MAUs, when you take a broad look at the month-on-month data, you’ll also be in a position to predict the future growth potential of your company (of course you need to tie the CLTV with this for the best predictions).
How to calculate DAU / MAU?
You need to check how many of your users perform an action on your app on a daily / monthly basis. And this number will be your DAU / MAU.
Here’s how WebEngage shows you your DAUs, WAUs (Weekly Active Users) & MAUs. Across operating systems and custom timeframes.
Any idea who popularised the DAU / MAU metrics? — The name will ring a bell.
2. Retention Rate
Another very important app metric to understand the usefulness of your app is your Retention Rate. Not all of your users will use your app very actively but they might still turn up to you in actual time of need.
And this is what defines your Retention Rate – the number of users who revisit your app (after installing) at least once, within a given time-frame.
Many marketers prefer focusing more on retention than acquisition (if the latter numbers are respectable of course) as your retention efforts do not cost you any money unlike the sales and marketing costs attached with your acquisition efforts.
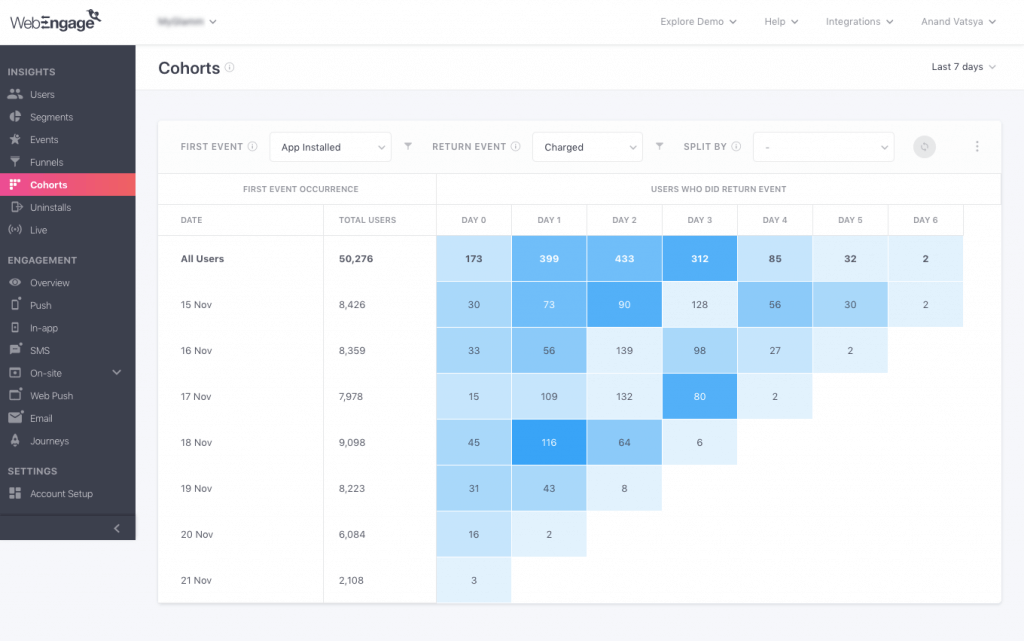
You’ll ideally measure your retention rates on a monthly, quarterly or yearly basis and the best part is you can even use cohort analysis to get a more granualarised view of your retention rates. A case in point could be when you push an app update and want to see how your users received it.
This is how we showcase cohort analysis on WebEngage’s dashboard.
How to calculate Retention Rate?
(No. of users at the end of a time period — No. of users acquired during this period) / No. of users at the start of the time period X 100
For example,
Say, a month back, you pushed an app update with some usability changes and new features. Let’s assume at this time you’ve 120 users. Now, you want to check how many users appreciated the changes you made and stuck with you after the end of the month. Let’s assume, after a month, you’re left with 60 users. But, you also need to remove the new users, that you acquired during this month from the equation, as you want to check the retention rates for the users who had this app when you rolled out the new changes. Let’s assume you acquired 20 new users this month. So, your resulting retention rate becomes 33%.
The inference you can derive from this is that the majority of your users did not appreciate the changes you made and as a result, uninstalled your app. (sounds like a great horror story, right?)
Did we hear you asking what’s a good retention rate? – On average, 30-day retention rate stands at 42% while 90-day retention rates fall further down to only 25%.
3. Stickiness Ratio
Stickiness Ratio is one of the most important mobile app metrics as it tells you how much value your users derive from your app, usually calculated over months. The calculation takes into account both DAUs and MAUs and a higher percentage is an indicator that more people find your app useful and actually return to engage with it.

Anshul Punhani
Chief Marketing Officer (APAC & Middle East), Monster.comStickiness or content that can make the 'Thumb' to stop scrolling, is one of the most important metrics that marketers need to consider, given the short attention span of app users. It is a combination of retention and engagement on the app, which are interdependent on each other.
The UX/UI, churn time, session length are some of the other important technical aspects that would need a marketer’s attention, to effectively plan the different acquisition and retention campaigns on the platform. These eventually create an emotional connection with the users, making them believe that the app is not expendable.
The stickier an app, the profitable it could be. A study from 2015 showed that the higher your stickiness ratio, the better you’re in a position to engage your users and avoid churn. Stickiness can also be sometimes referred to as the number of sessions (times a user opens the app) a user generates on the app since the more sessions a user generates, the highly engaged they are.
How to calculate Stickiness?
Daily Active Users (DAU) / Monthly Active Users (MAU) x 100
For example,
Let’s say, your daily active user (DAU) number is 2000 and your monthly active user (MAU) number is 10,000. Your stickiness ratio hence becomes 20%.
What’s a good Stickiness Ratio?
Andrew Chen says that apps over 20% stickiness ratio are good while over 50% are world class.
Especially for entertainment apps like Spotify and Netflix, this is a very important metric.
4. Average Session Length
Average Session Length refers to the amount of time each of your users spend on your app, on an average.
It is not a universal app metric and its applicability depends on the industry you operate in. The reason why this is worth tracking is that it gives you an idea of how valuable, do your users, find your in-app content. Which if they do not, then you will be required to do some A/B testing to understand your user preferences.
Apps like Spotify & Netflix greatly benefit from having an eye on this metric as it tells them if their recommendations are in-line with their users’ preferences. On the contrary, for someone like an Uber, the longer you spend on Uber looking for rides (session time), the worse it gets for them as it means they’re not able to instantly serve you – a problem statement even Google grapples with. For time tracking apps like Paymo, Clockify, and RescueTime, Average Session Length indicates user engagement with features like time logging and productivity tracking, but excessively long sessions may point to usability issues.
How to calculate Average Session Length?
Total duration of all sessions (in seconds) during a specified time frame / total number of sessions during that same time frame
This data can be found on Google Analytics.
5. Churn Rate
Churn Rate is exactly opposite to retention rates and is defined as the rate at which your users uninstall your app or even cancel / downgrade subscriptions. While churn rate is bad in itself, it becomes especially problematic when your most valuable / top revenue-generating users churn, which can adversely affect the overall unit economics of your business.
A rising Churn Rate is bad for you, in any imaginable sense, devoid of the industry you operate in. But the biggest problem with Churn Rates is it’s extremely difficult to precisely understand why your users are dumping you. There can be many reasons ranging from decreased usability, absence of new content, switching to a rival or even too many app crashes.
How to calculate Churn Rate?
1 — Retention Rate
Here’s how the app uninstalls (Churn rate) section on the WebEngage dashboard looks like. You can track both Install & Uninstall trends. Know which of your campaigns are contributing most towards uninstalls. And go deep into analysing your uninstalls by channel, location and even landing pages (among a whole host of other options).
How about some churn rate stats?
According to Statista, as of 2018 second half, the average 3-month churn rate of mobile apps worldwide stood at 71%.
There are, of course, ways for tackling Churn rates and the sooner you start employing them the better.
6. Exit Rate
Exit Rate is often confused with Bounce Rate but there’s a huge difference between the two. While it’s important to know how many of your users are abandoning your platform without engaging with your content (Bounce rate), what’s arguably more important is from which exact screen did they drop-off (Exit rate). And when we’re talking mobile app, the focus should actually be on Exit Rate.
Why?
Because this will give you an idea of your least converting screens that need fixing. This could be because either your users aren’t deriving enough value from the particular screen or it’s not matching your users’ expectations. And to zero down on the precise reason, you’ll have to take help of some usability testing.
How to calculate Exit Rate?
Total no. of Visits to a screen / total no. of exits or drop-offs from that particular screen
For example,
Let’s say, you’re an investment app and your users need to navigate through 8 screens to complete their sign-up process, to begin investing. On an average, about 40% of your users do not complete the sign-up process, dropping-off at various screens. You noticed that screens 4 & 7 see the highest percentage of drop-offs as compared to the others in the sign-up process. This means that there are some issues with the two screens, which you can do a usability test to find out, and then go on to fix it to improve your mobile conversion rate.
A marketing automation software can tell you about the total number of drop-offs from every screen.
Download Impact Story – See how ALTBalaji, a popular on-demand video platform increased their retention By 30%
App Metrics for Conversion
1. Goal Completion
Goal Completion is one of “the most important metrics” when it comes to evaluating conversions, no matter if you’re talking websites or mobile apps. Popularized by Google, Goal completion is used to track anything to everything, signifying that your users are not only interacting with your platform but are also deriving actual value from it.

Shuchi Chawla
Head of Brand Marketing, ixigoConversion rate (or goal completion) is a very important metric to look out for in the post-install phase. It gives a good indication of our targeting superiority, how effective is our messaging and if we have a good handle on our customer pain points. Couple that with retention rates and one can easily understand their full customer lifecycle engagement picture and user stickiness.
Goals are like checkpoints in your user journey where every checkpoint can be an eventual goal in itself, like signup for a newsletter or can be a pathway to a larger goal, like making a purchase. The best part about goals is that it doesn’t have any concrete definition and you can set any goal based on the user activities that are important to your bottom line — registration, purchase, signups, form submissions, or any other custom event.
Some key problems that you can identify by measuring your goal completion metrics are,
- Identify checkpoints that see a major number of drop-offs
- Goals that take the most time to completion
- Goals that have major obstructions, etc.
Your goals should always be the ones that affect your revenues, either in the short-run or long-run.
Here’s how WebEngage can help you track your conversions (goals) across different types of in-built and custom events.
2. Time to Goal Completion
Not a lot has been said regarding Time to Goal Completion as an important metric but for every promotion that you do (or even in general circumstances) knowing the number of users who completed the goal is just not enough.
What about the ones who did not? What stopped them? Were there any distractions that unknowingly crossed their paths in their buyer journey? Or was your messaging too subtle for your users to understand what action you want them to take?
Time to goal completion can tell you if your users are taking more than the required time to complete your desired actions – fulfil the goals. Which, if true, will pose you with a question on all the possibilities that could be hindering their journey. It could be anything from convoluted messaging to users getting lost on your site, or as we said, unintentional distractions.
It’s important to understand your user’s intent with respect to the point they’re in on your platform, and not distract them (with maybe upselling) before they’ve made the purchase.
It’s for this reason only that many B2B companies don’t prefer putting long videos or even blog posts on the “request demo” page of their websites. As at this particular point, they want their users to just sign up for the demo and not do anything else.
The issue with this is that there’s no platform that can give you a unified view of this data. You can either take the help of marketing automation tools or CRO tools such as Hotjar.
3. Average Order Value (AOV)
While focusing your efforts on increasing your website traffic and reducing your cart abandonment rates is extremely important, a small mistake a lot of marketers end up doing is not putting enough emphasis on Average Order Value.
So what is AOV?
Average order value is the amount of money spent by your customers on every single order they place on your app. Being in the know of your AOV can help you evaluate your pricing and marketing strategies and it’s one of those metrics that directly impact your bottom line — revenues. (Something to note here is that AOV is sales per order and not sales per customer)
According to Statista, as of the first quarter of 2019, online orders placed from a mobile phone had an average value of $77.71 while those generated via direct traffic had an average value of $105.16.
Increasing AOV is a sure-fire way of offsetting your customer acquisition costs, scaling your profit margins and growing your overall revenue, without putting increased emphasis on acquiring more customers to increase revenue.
How to calculate AOV?
Total Revenue / No. of Orders
For example,
Let’s say, you sell three different kinds of t-shirts which are priced at Rs 200, Rs 300 & Rs 450. Now, your AOV comes out to be Rs 317. Given that two of your t-shirt types are priced below this AOV, you can say that your lower priced items constitute a majority of your sales. But you also know that higher-priced items mean better margin. For which, you can now run campaigns to increase the sale of your higher-priced items, thereby improving your AOV. Alternatively, you can target high spenders to enter loyalty/rewards programs whereas low spenders can be targeted with coupons, sales and offers.
Being able to successfully increase your AOV could also mean that for the same acquisition costs, you’re extracting more revenue from your customer which is ultimately what you want.
App Performance Metrics
1. App Load Time
App load time should be supremely important for you if you don’t want your users to abandon you without even experiencing what you got to offer. People want their mobile experience to be fast and smooth and if it takes too much time to load, you’re in for a backlash.
Why don’t you try recalling when you yourself were struggling to get along with a certain app and what did you do when your attempts turned fruitless.
A report from Apteligent says that the best of apps have a load time under 2 seconds, failing to maintain which, can lead to 25% of your users abandoning your app.
Thinking your app has a high load time? Here’re some solid tips on reducing your app load times.
2. App Crashes
Similar to App load time, app crashes is another big stumbling block in your app’s path to success and refer to abruptly shutting down of your app. App crashes have often been referred to as a bigger problem than higher app load time because, in the former’s case, people have to start all over to complete what they were doing. Pretty daunting, right?
And it’s probably for this reason that users are particularly less forgiving when it comes to app crashes. Want to know the tolerance levels of users when it comes to sticking with an app that crashes? — Only 16% of respondents say they’ll try a failing app more than twice. Cruel!
You need to constantly track your app crashes. In particular, the following 4,
- How often your app crashes?
- How many times a day it crashes on users?
- How many users are affected by your app’s crashes?
- What were your users doing when the crash occurred?
3. App Latency
App Latency is the amount of time it takes for an app to make a request (once a user clicks on something) and get a response from the API. Ideally, you would want your latency to be as less as possible, although zero latency is supposed to be a dream for the foreseeable future.
According to a study by Appdynamics, the acceptable rule of thumb is to optimise for 1 second of response time. Anything over 3–4 seconds of response time and you’ll see your abandon rates skyrocketing. In order to implement this metric, some companies may seek for additional nearshore software development expertise or opt for an in-house developer.
Vanity Metrics
Any metric which does not affect your bottom line of either generating revenues or enhancing the engagement rates can be considered a vanity metric.
One way to evaluate if these actually are vanity metrics is to identify how big of a loss it would be if you don’t track them. Or better yet, for a month, don’t track the following (if you already are) and see how less of an information do you have regarding the important aspects of your app / business for that month.
1. Average Screens Per Visit
According to some, average screens per visit signifies engagement levels — the greater number of screens a user sees, the greater is their engagement level on the app.
The reason why this is a vanity metric is if a user visits 10 screens on your app, but doesn’t make a purchase, then you’re still at ground zero. Moreover, the average screens per visit can give you a very hollow picture if you’re not tracking the on-screen time along with it, as a user might just be flipping through the screens. (And trying to capture both the data pointers and then analysing them together could be a real pain)
The two most important things that you want to know about your app is if people are not facing any challenges as they’re moving closer to the goals you’ve set up and if they are, then which screen(s) is causing the most drop-offs. And tracking the average screens per visit contributes to neither of the objectives.
2. Number of Registered Users
For once, just open Play store / app store of your phone and look at the descriptions of the various apps. The one common thing you’re bound to find in as many as over 60% of the apps’ description is, “we have X00,000 registered users” but what no one will tell you the number of active users within that herculean of a number.
The point is if you’ve 500,000 registered users but the MAU is only 50, then what’s the point in having that high a registration number. This also means that you’ve been concentrating all your efforts on the acquisition and almost zero emphases on retaining users.
The number of registered users is a vanity metric and what you need to instead focus on is the number of DAU & MAU which will actually affect your bottom line.
3. App Downloads
Mirroring the No. of registered users is another metric called App downloads. Ironically enough, this is another number that you’ll very often come across in the app descriptions as this number is almost always high but marred with hollowness. You can’t extract any kind of answers from your app download numbers.
According to a 2018 report by AppsFlyer, 28% of apps are uninstalled within the first 30 days while Statista says, around 25% of apps are only accessed once in their lifetime — pretty worrying statistics, right?
In such a scenario, it’s difficult for companies to talk about their Daily / Monthly Active numbers so instead, they use the total download numbers as a drape – that’s neat, isn’t it?
But in actuality, app downloads do not paint even half a clear picture regarding the popularity or usefulness of the app and should never be taken into account to drive business decisions. If you’ve got 100,000 people downloading your app every month but even 100 are not completing a purchase, then what’s the use.
In place of this, what you can track is which sources your users are coming from to download your app. This will give you an idea of the most efficient channels that drive your acquisitions and if you need to concentrate more efforts on them going forward or the efforts you can take to rectify the lagging channels.
Bonus Read – Checkout These 8 Impactful Tips To Boost Your App Downloads
4. Average Daily Sessions Per DAU
The problem with Average Daily Sessions per DAU is first, it applies to a very small number of industries and second, just like all the other vanity metrics, it doesn’t affect your bottom line.
By definition, it shows you the number of times your daily active users open your app, supposedly, an indication of how engaged your users are with your app. But as we said, it applies to very few industries, for example, the social media apps and maybe, even the e-commerce apps.
Similar to the other vanity metric of Average Screens per Visit, just because a user opens your app only once a day, does not mean that they’re less engaged. Because if you’re an e-commerce app, the same consumer will not make a purchase every day. Even for social media, a better metric could be average session length because it can help them understand if they’re delivering the right kind of content to their users.
Liked the infographic? Share it with your peers!👇 Infographic: Most important mobile app metrics for 2022 and beyond! Share on X
Your True North Star App Metric
While all the mobile app metrics we’ve talked about above are important in some or the other aspect (except the vanity ones of course), there has to be a true North Star Metric that you can always keep an eye on.
In this case, it’d be your “App Reviews & Ratings”.
Your App Reviews & Ratings ultimately define the kind of perception people will have of your app before they download it and you need to make sure that it’s a good one.
According to this survey by Apptentive, 59% of people usually or always check the app ratings before downloading a new app. This one metric might not help you in achieving any of your larger objectives around retention or conversion; however, it can tell you one very crucial thing — if your users are happy with your offerings.
Both Apple & Google use average ratings and number of reviews to determine the usefulness of apps and no matter what, you need to make sure that the two metrics are always under green light. This will help your app being shown up more often in the store’s search results. Because even if it fails to happen once, it might get very difficult to get the app back up among the goods.
Summing Up
Before wrapping up, I’d again want to re-emphasise on what I said earlier, “not all of these app metrics will find a use-case in your business and you need to have a prior idea of what do you intend to achieve by measuring every single of these metrics”. It will also be good if you know about your industry standards before you start measuring them as for example, no two industries will have the same retention or even churn rates.
Want to optimize your mobile app metrics? Book a demo with WebEngage today!
FAQs
How do you measure content engagement?
Content engagement in mobile apps can be measured using metrics like session length, page views, and interactions (likes, shares, comments). Monitoring these indicators helps understand how users interact with your app’s content, revealing what captures their interest and keeps them engaged.
What is KPI for measuring engagement?
Key Performance Indicators (KPIs) for measuring engagement include Daily Active Users (DAU), Monthly Active Users (MAU), Stickiness Ratio, Average Session Length, Churn Rate, and Exit Rate. These KPIs provide a clear picture of how often and how long users interact with your app, which is essential for gauging engagement.
What is mobile app engagement?
Mobile app engagement refers to the level of user interaction and activity within an app. High engagement means users frequently use the app and spend significant time on it. It’s an indicator of how captivating and useful the app is to its users.
What is the difference between app engagement and retention?
App engagement measures how users interact with an app, like session lengths and frequency of use. Retention, on the other hand, focuses on the percentage of users who return to the app after their first use. While engagement shows how users use the app, retention shows how often they come back.
What is a good engagement rate for an app?
A good engagement rate for an app varies by industry and app type. Generally, higher rates indicate that users find the app valuable and engaging. For most apps, a daily engagement rate between 1% to 5% are considered healthy benchmarks.


 Vanhishikha Bhargava
 Diksha Dwivedi
 Dev Iyer