


Events are the core data stream on WebEngage. Everything you wish to know about user behaviour starts with Event Analytics. We have rebuilt Event Analytics for teams that want to dig deeper, compare smarter, and answer questions faster. The new experience unlocks these for you…
- Split your analysis by event or user attributes; compare these splits side-by-side in the same viewport
- Choose flexible reporting windows (and presets); compare with a similar period in the past
- Pin and Monitor any metric on the Event Analytics screen to your daily Dashboards
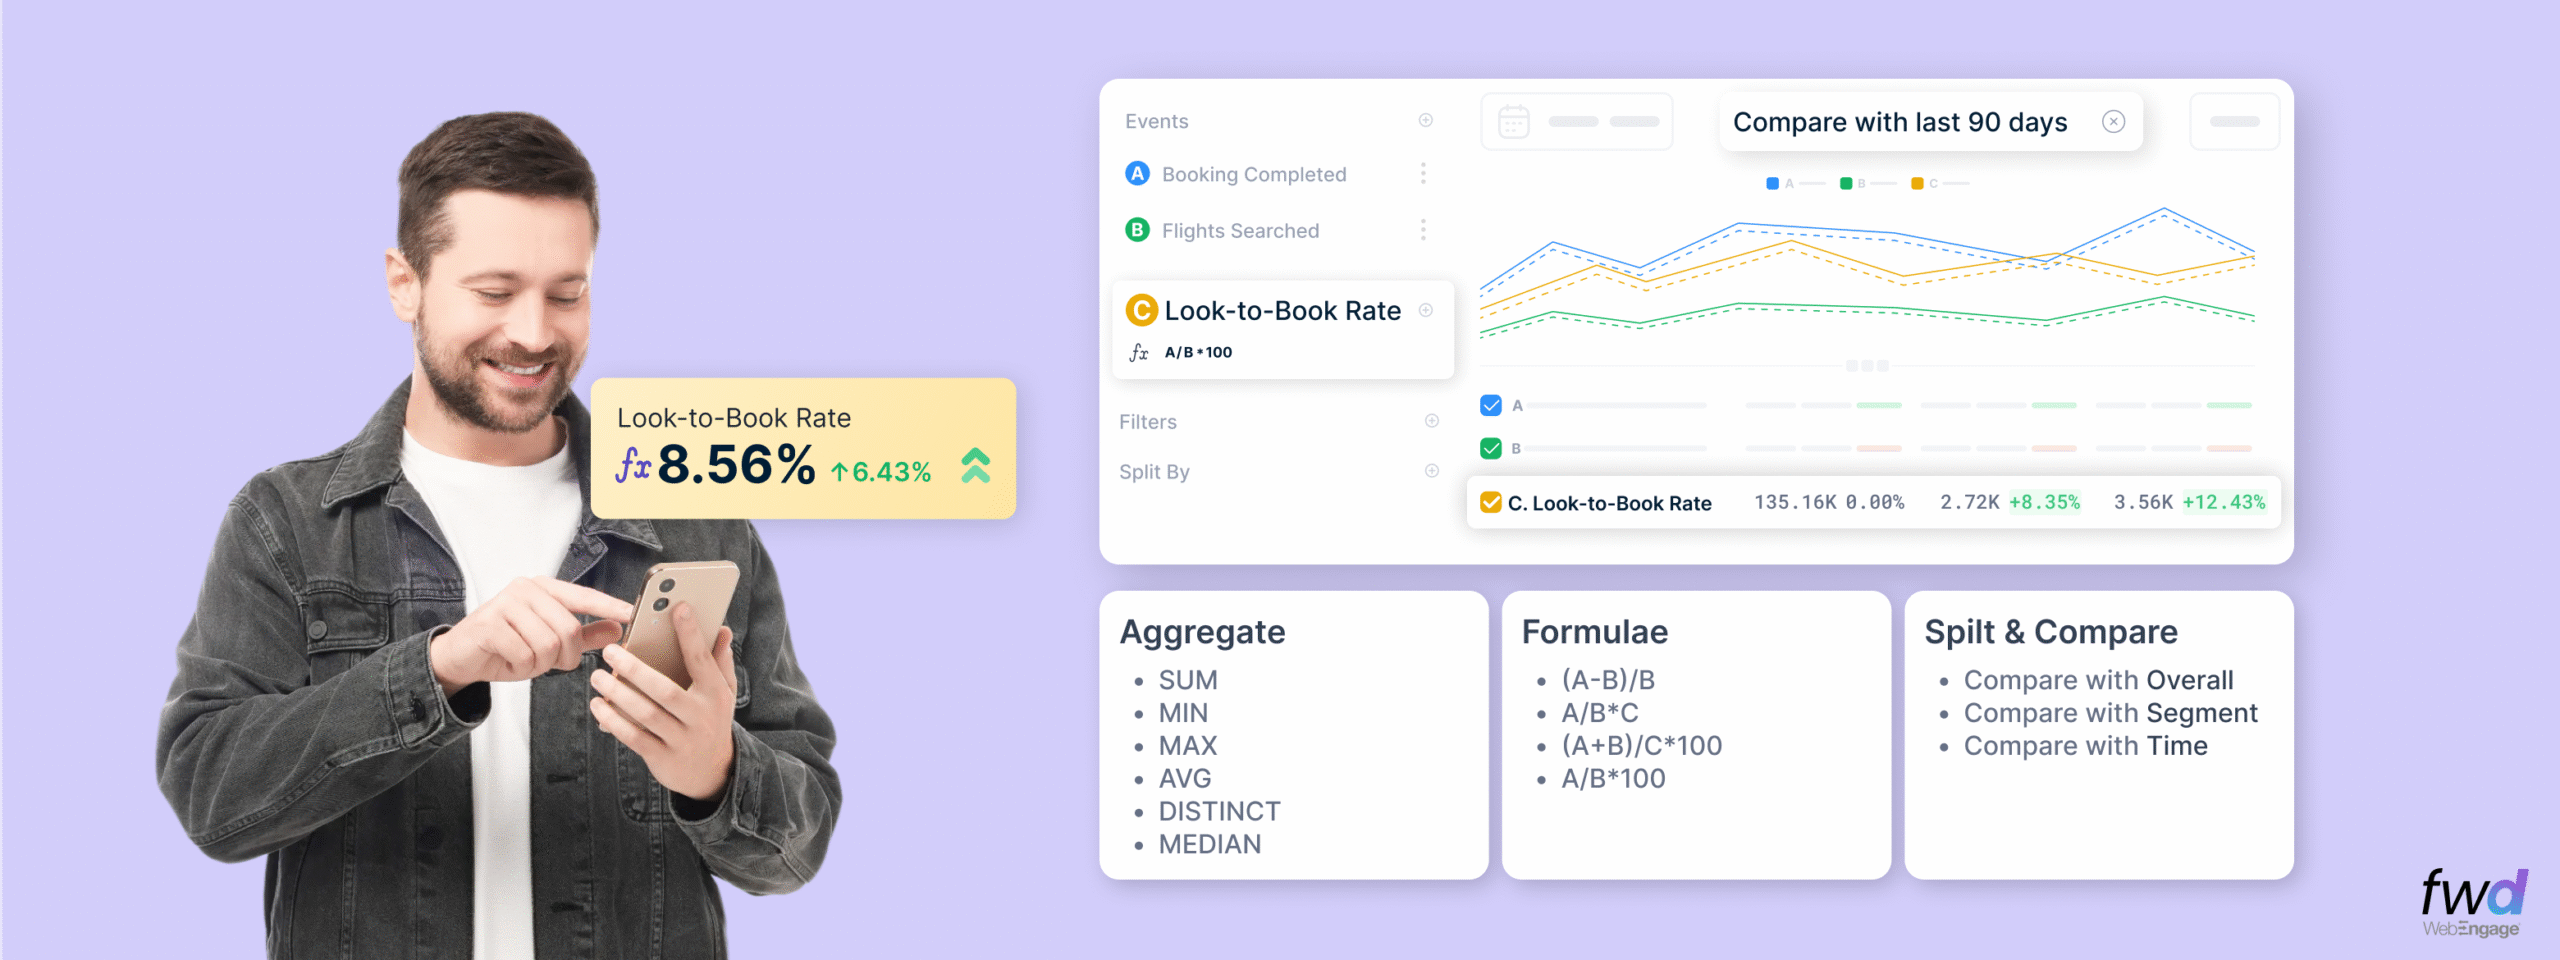
- Say hello to Formulas – easily measure impact with formulas to compute attributes like AOV, LTV, Categories Affinity etc
Split & Compare
Splits allow you to dice-n-slice your event data to answer basic questions around who performed these events, which split values are the most significant etc. You can use any user or event attribute for your split analysis.
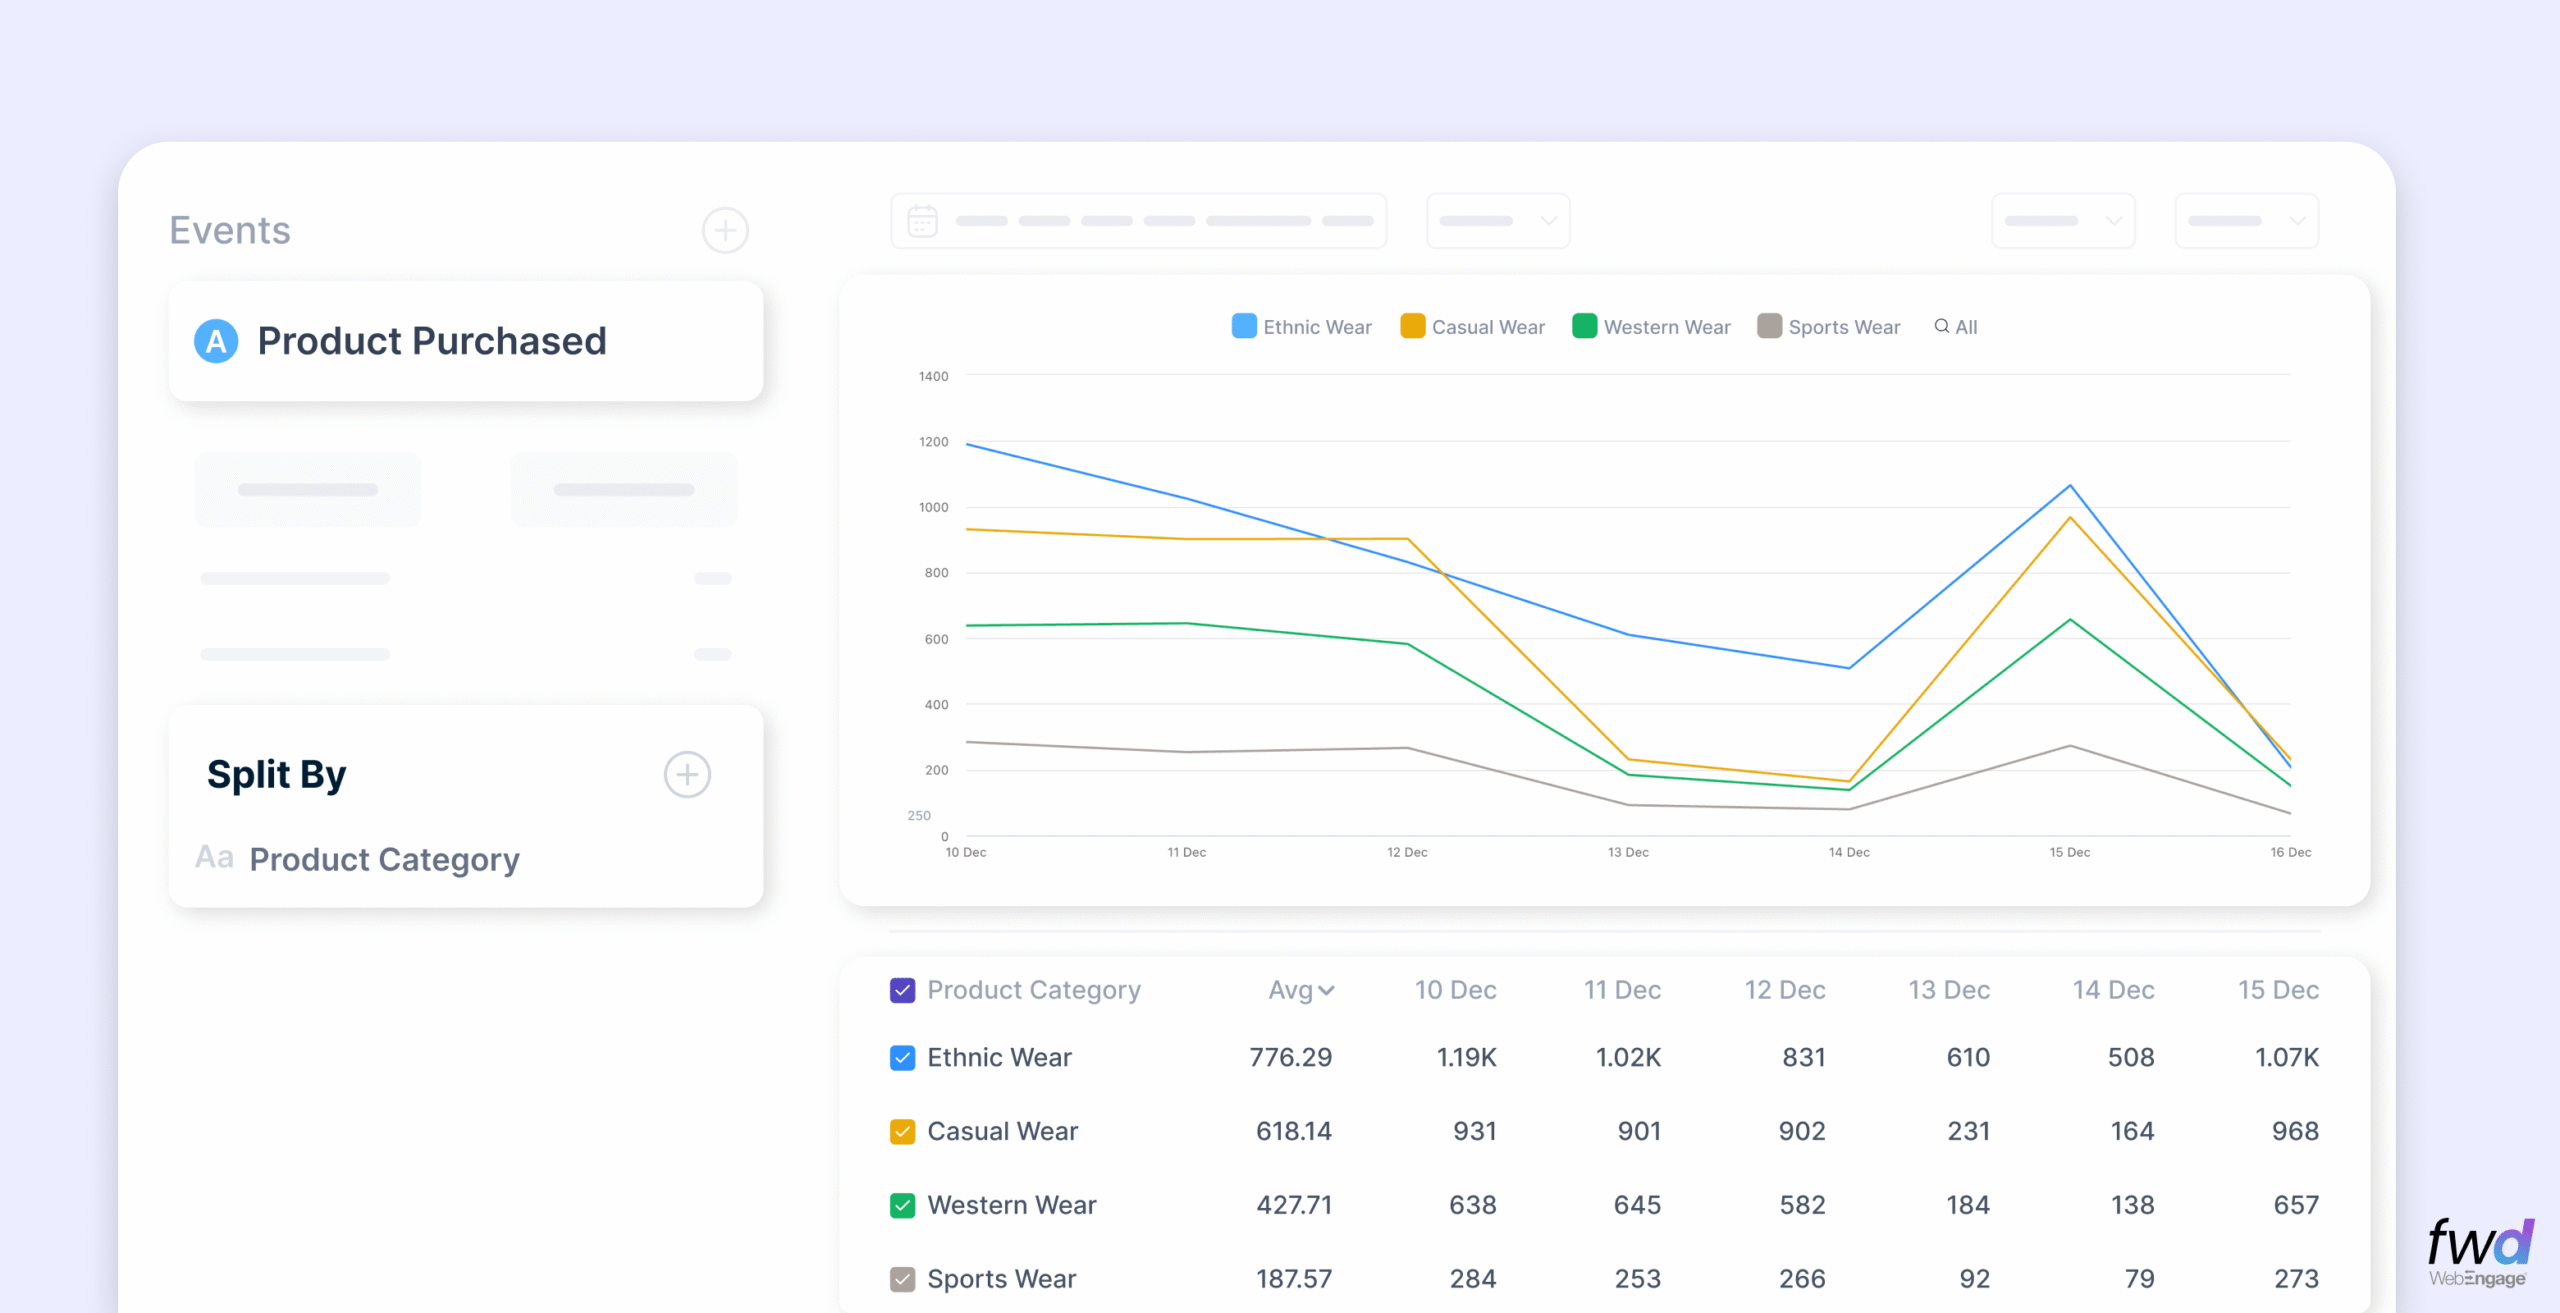
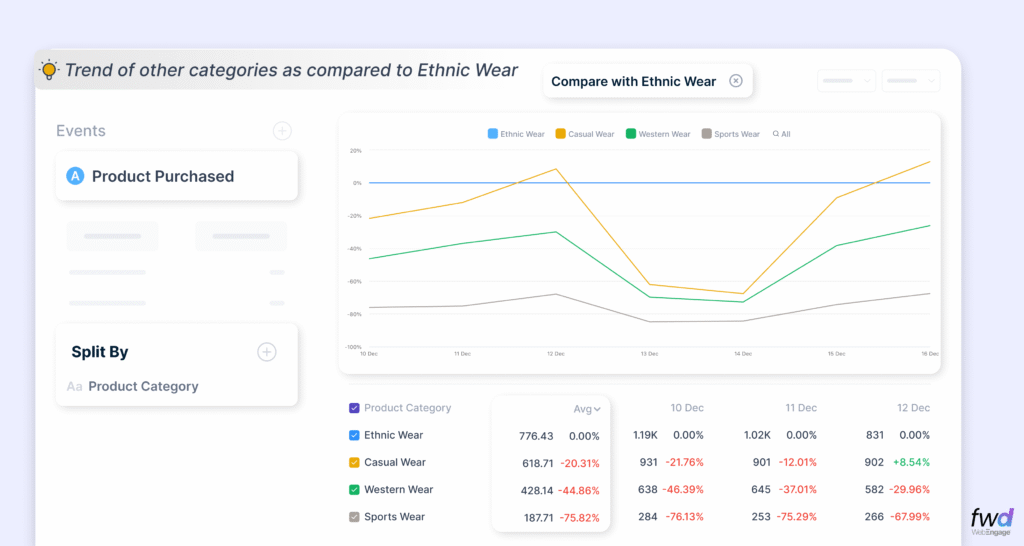
In the example above, you can see a comparison of the event “Product Purchased” on its “Product Category” attribute where the comparisons are being made w.r.t the “Ethnic Wear” category.
Flexible Reporting Windows & Time Period Comparisons
We have made it super simple for you to choose from time period presets – week to date, month to date etc.
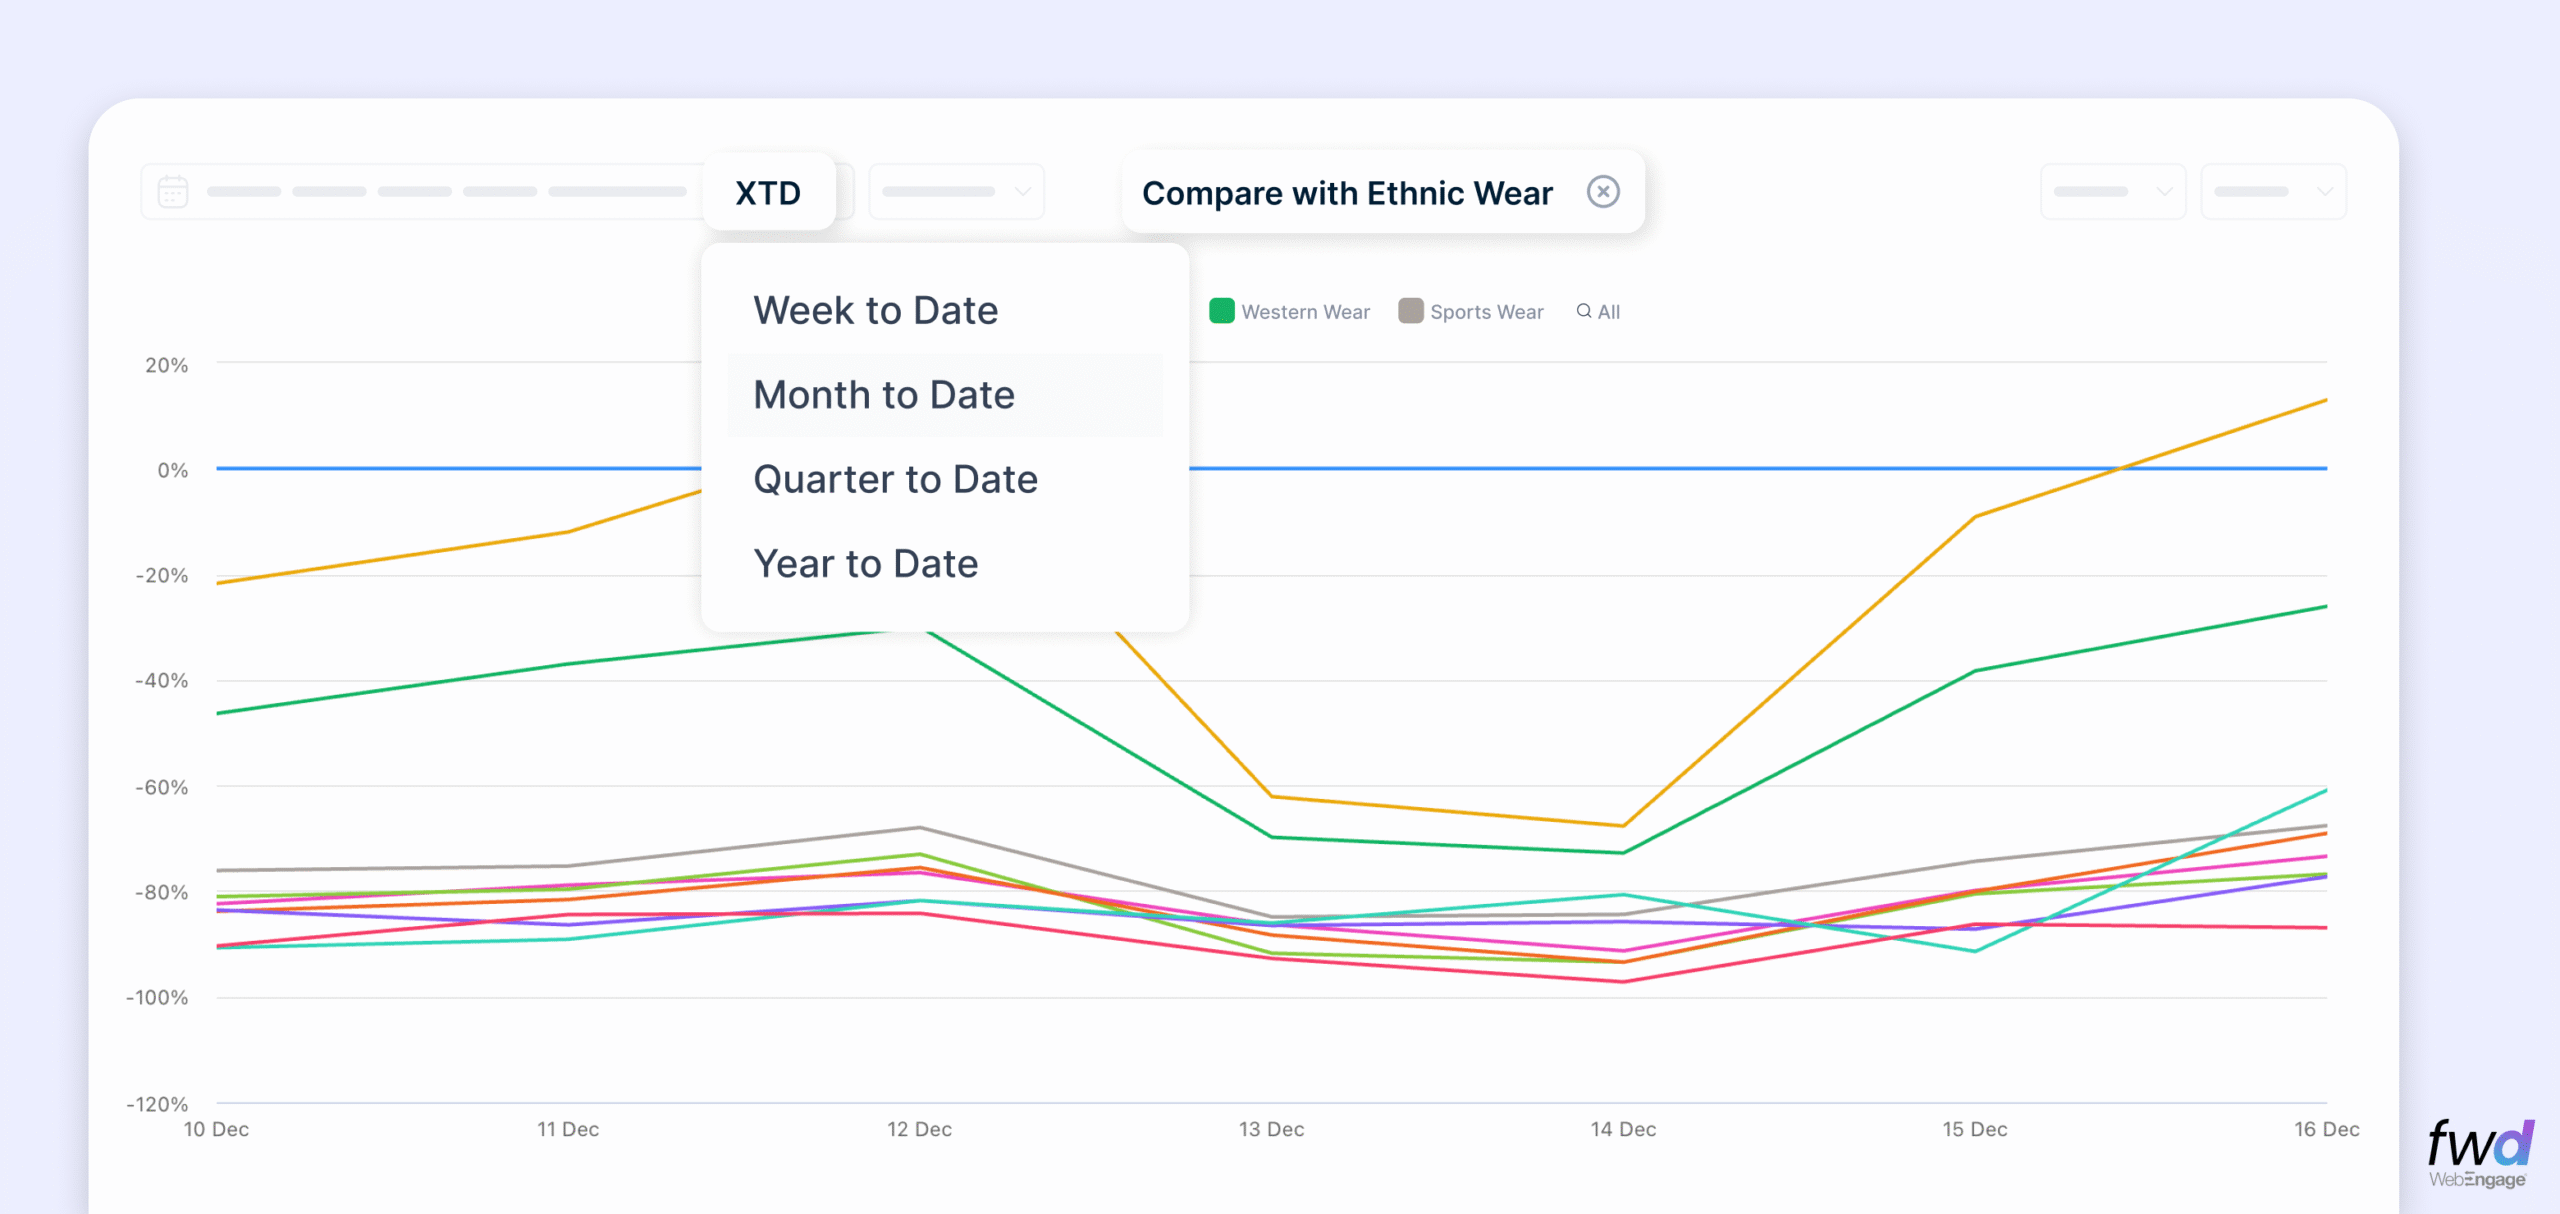
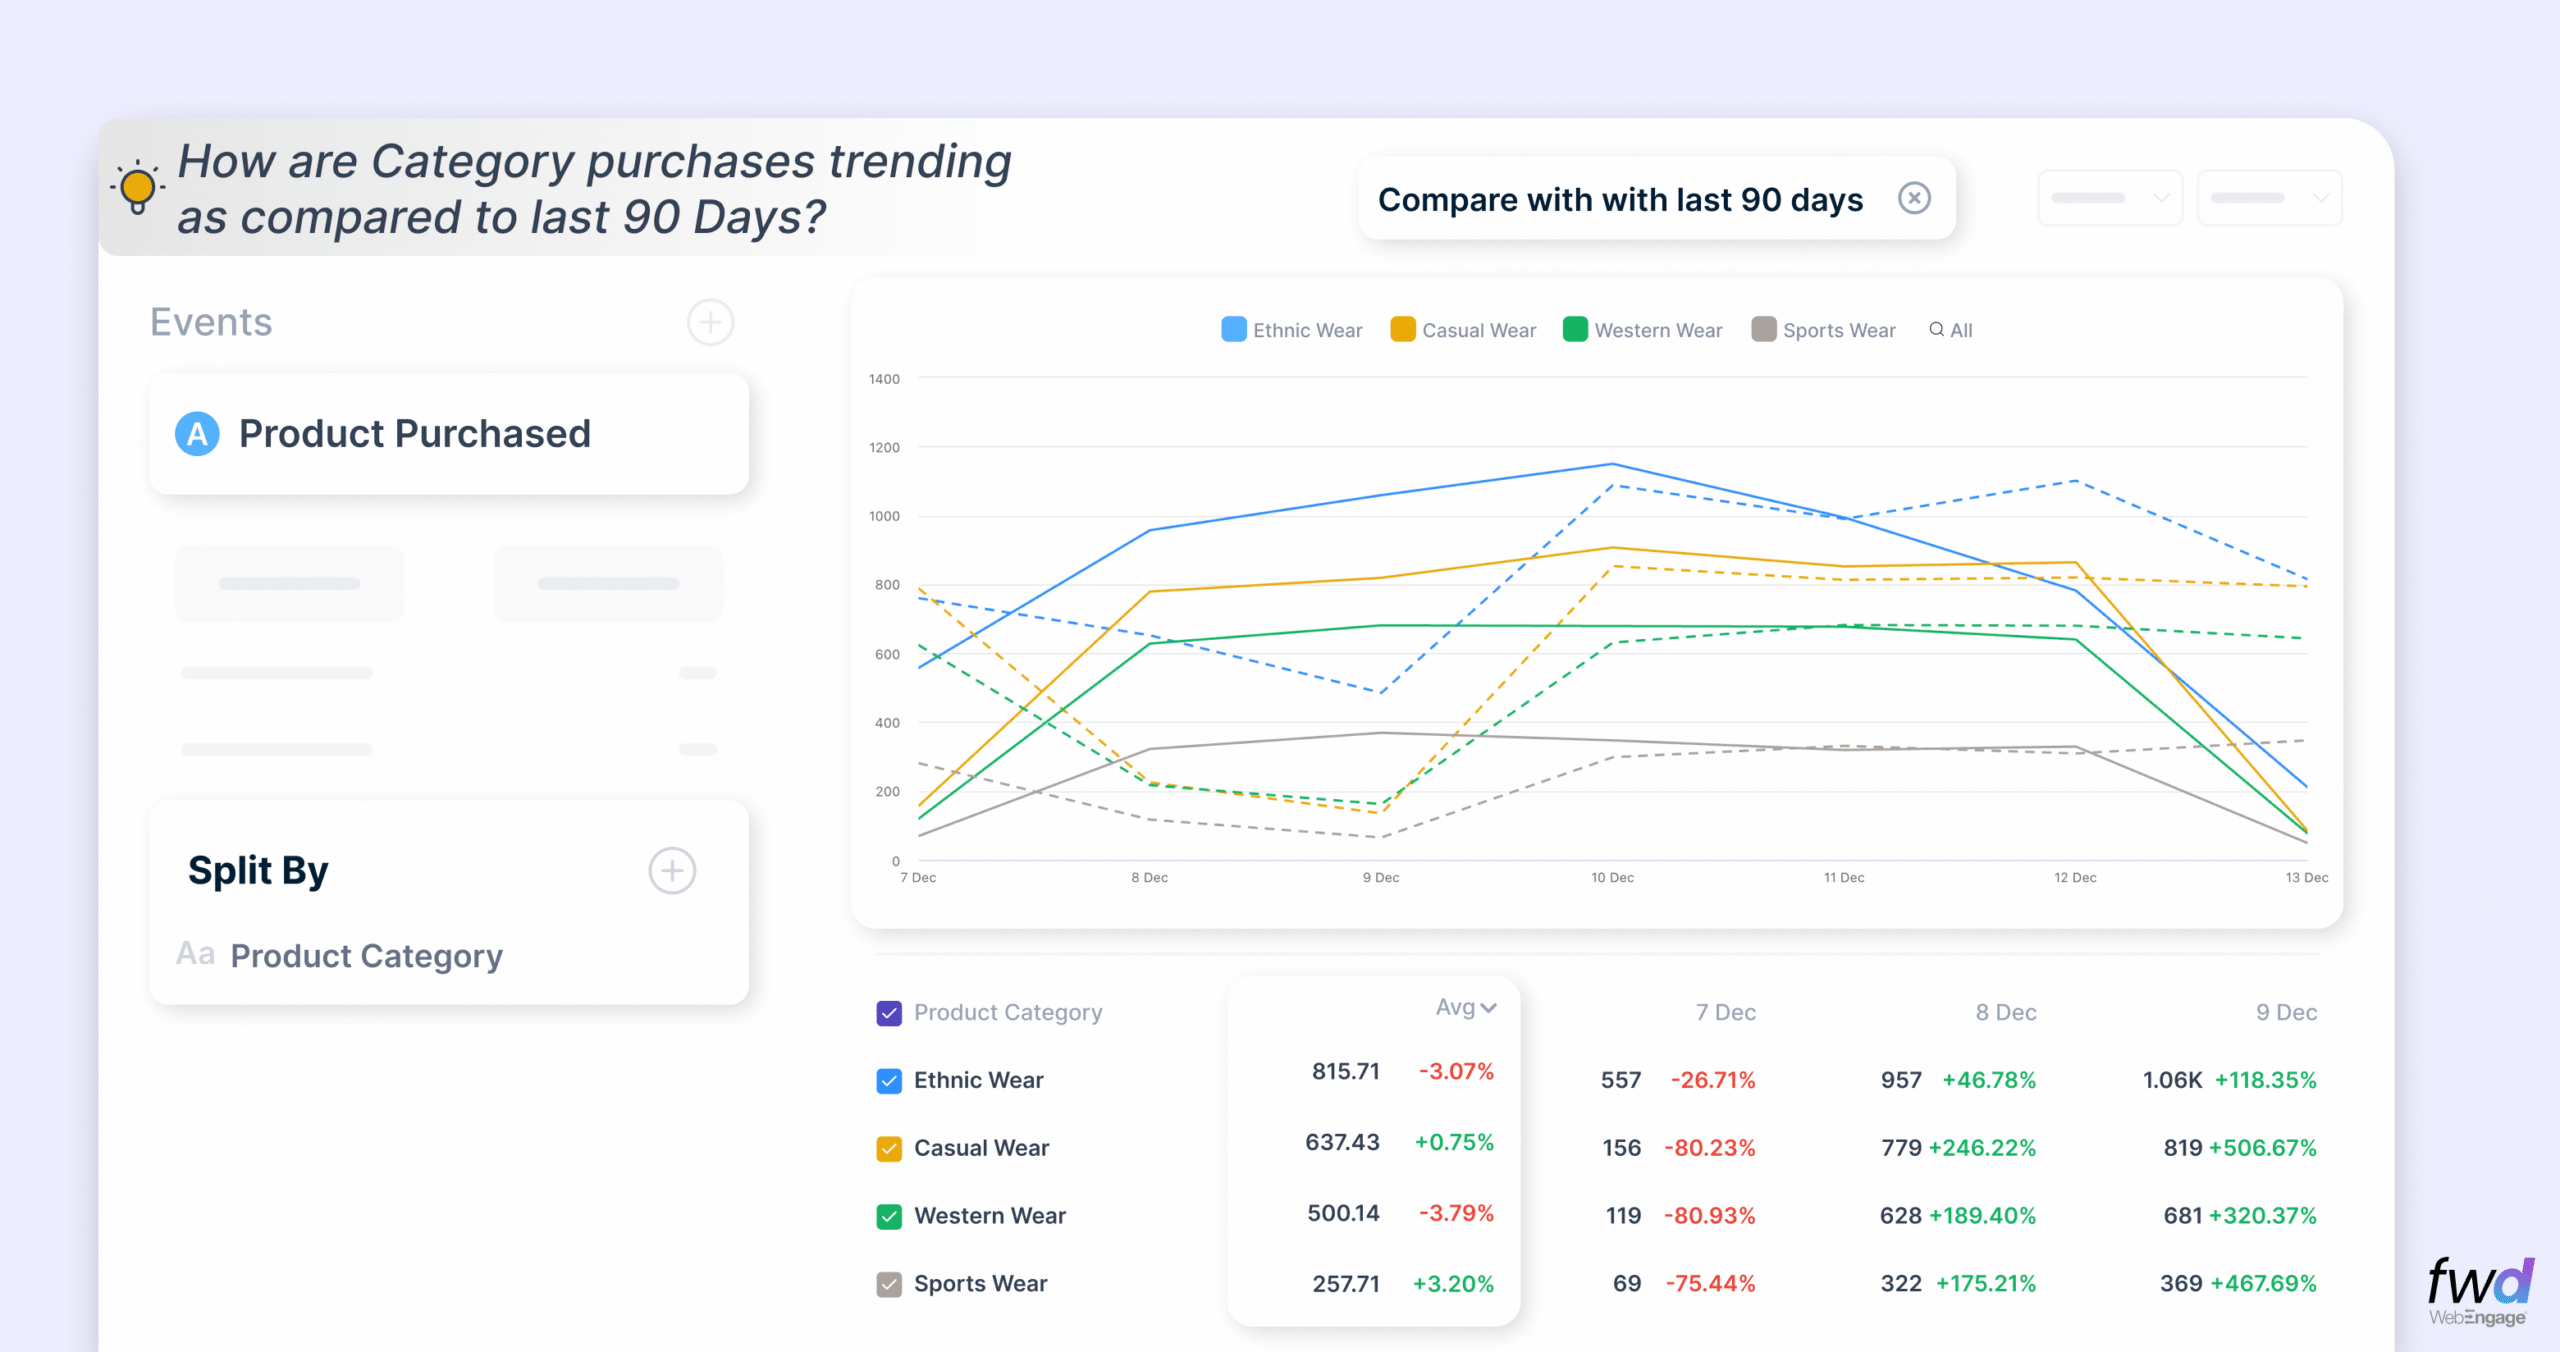
Of course, you can compare metric from this week vs the last week, this month vs the last month and so on. This lets you spot seasonality and anomalies easily.
Pin & Monitor any Metrics that matters
Our Metric Card lets you save the KPIs that matter the most. You can pin, track and share these cards with your team. They content in these cards are constantly refreshed to give you the latest data. These cards are designed to act as your personal KPI Monitor.
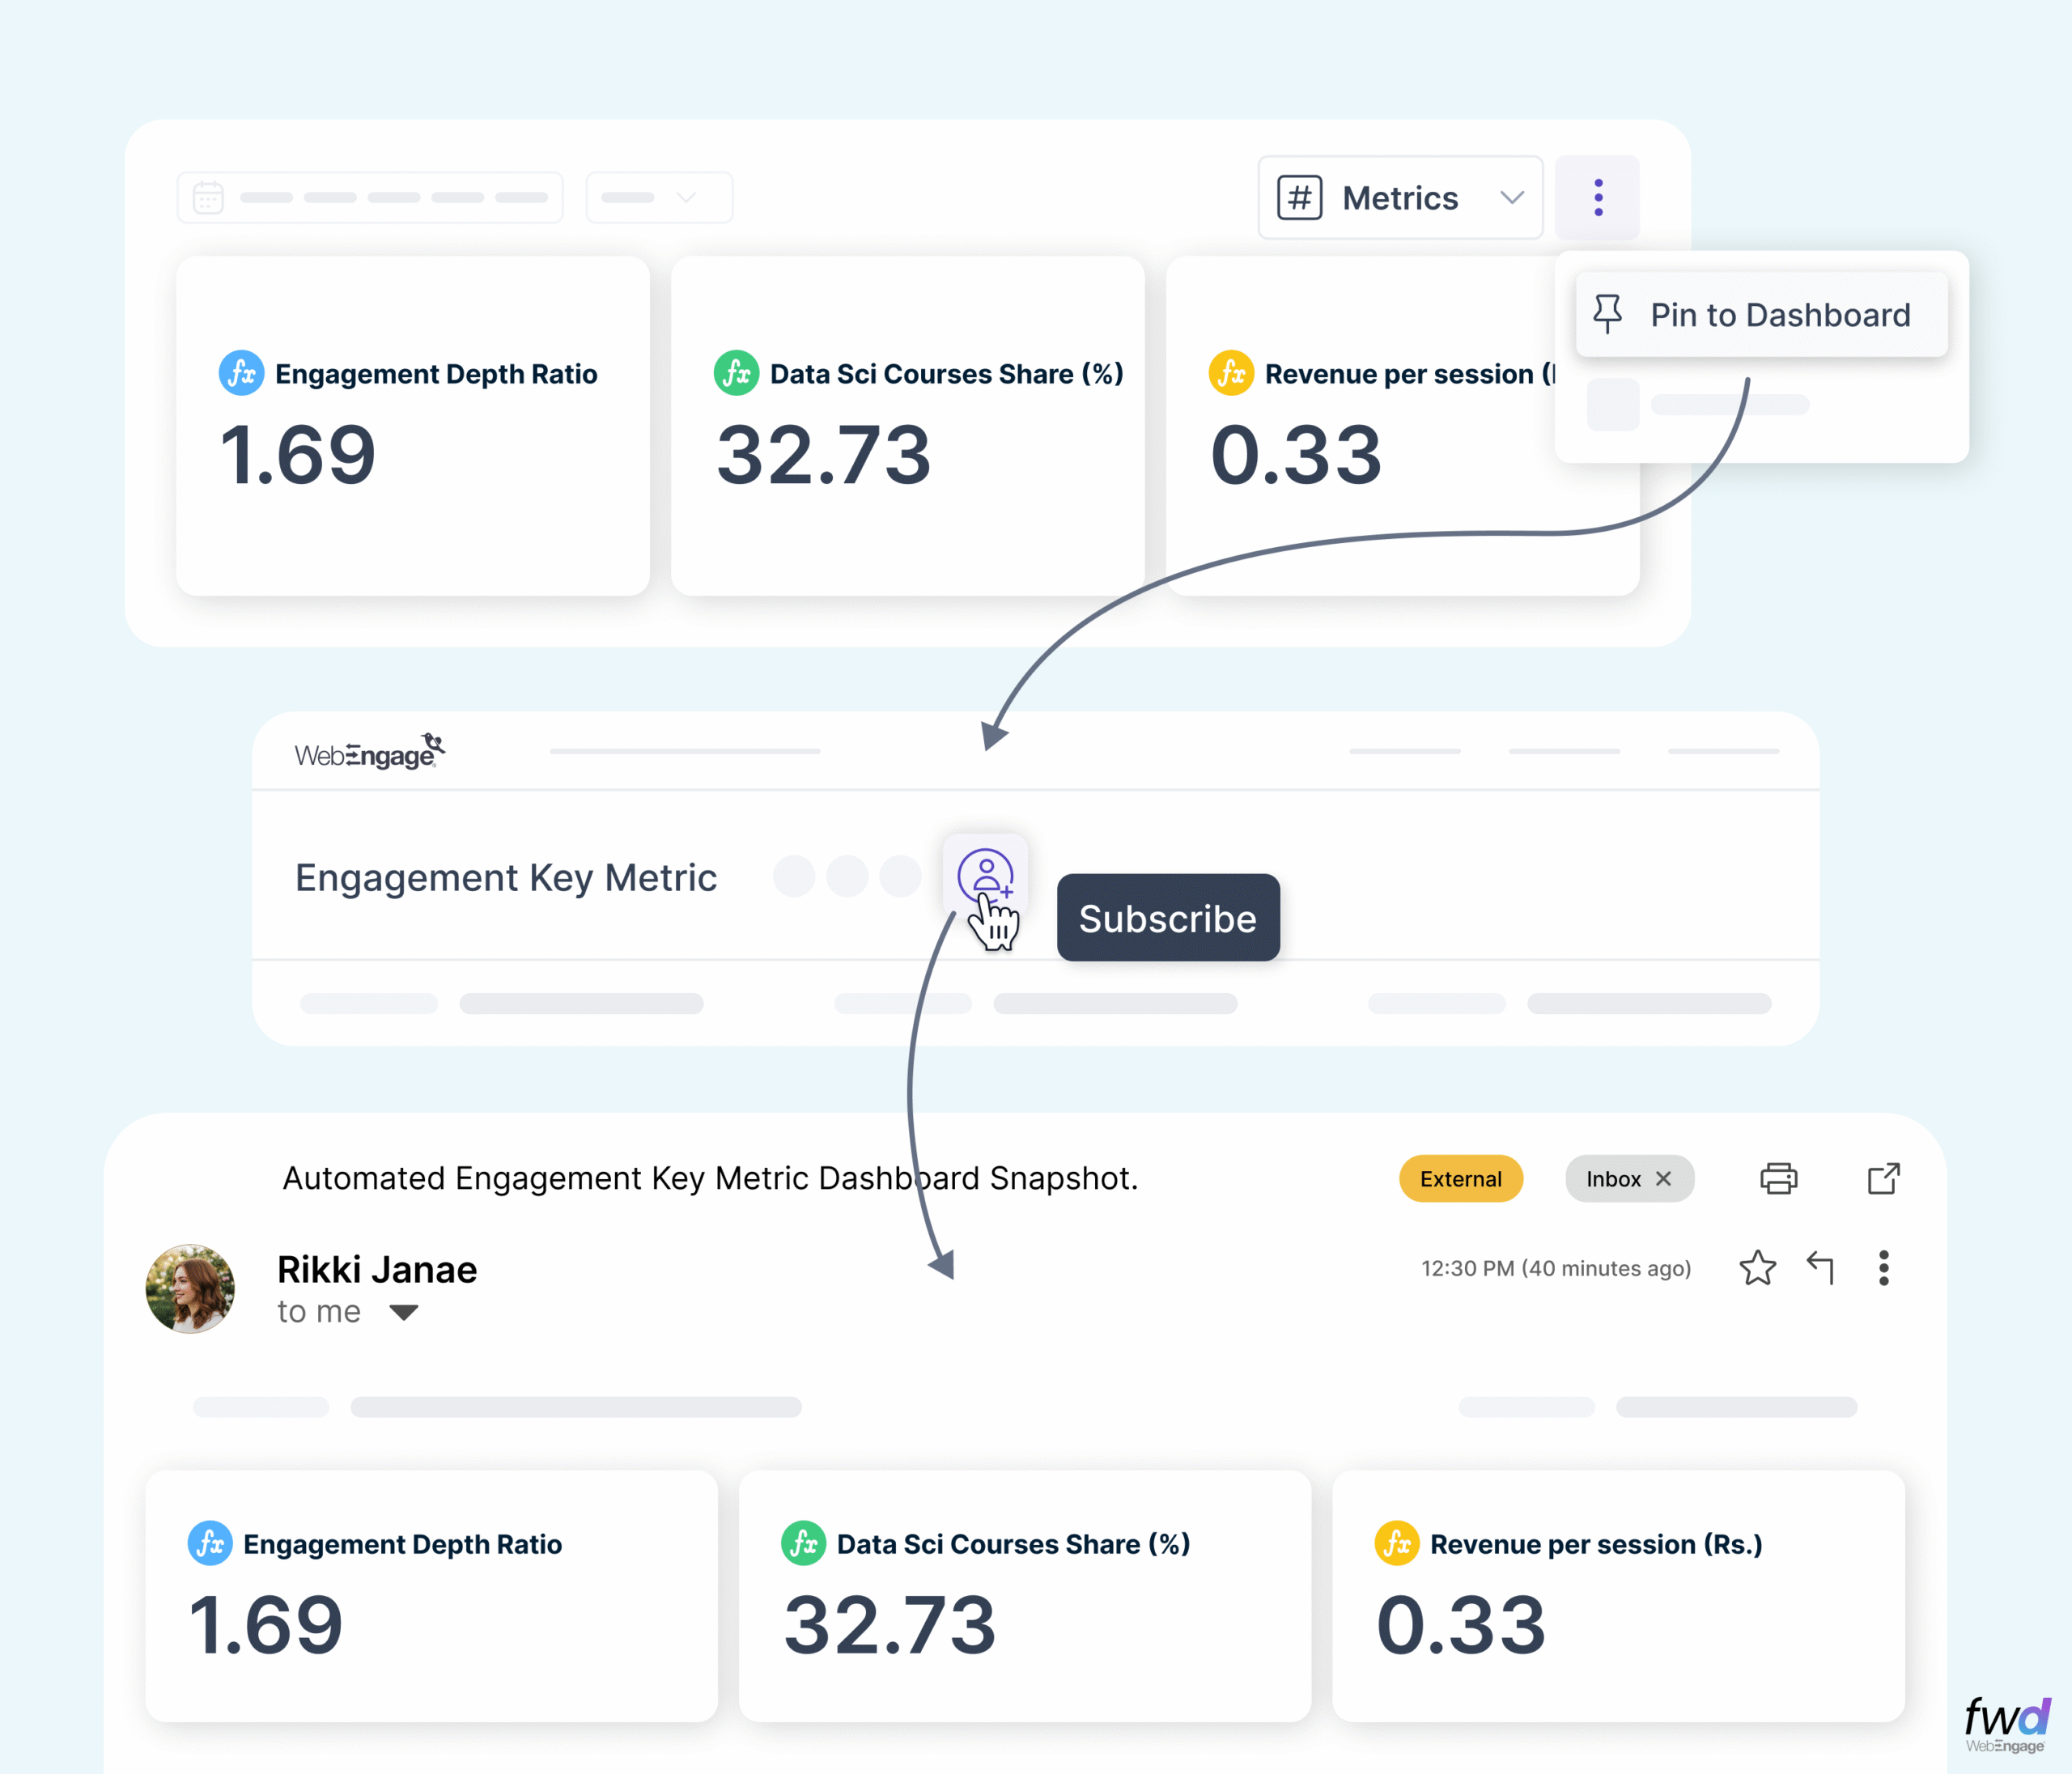
Hello, Formulas – now build and track your OWN Metric!
Forumlas help you create a completely new business metric using aggregates and derivations. You can now easily measure and monitor metrics like Average Order Value (AOV), Lifetime Value (LTV) etc.
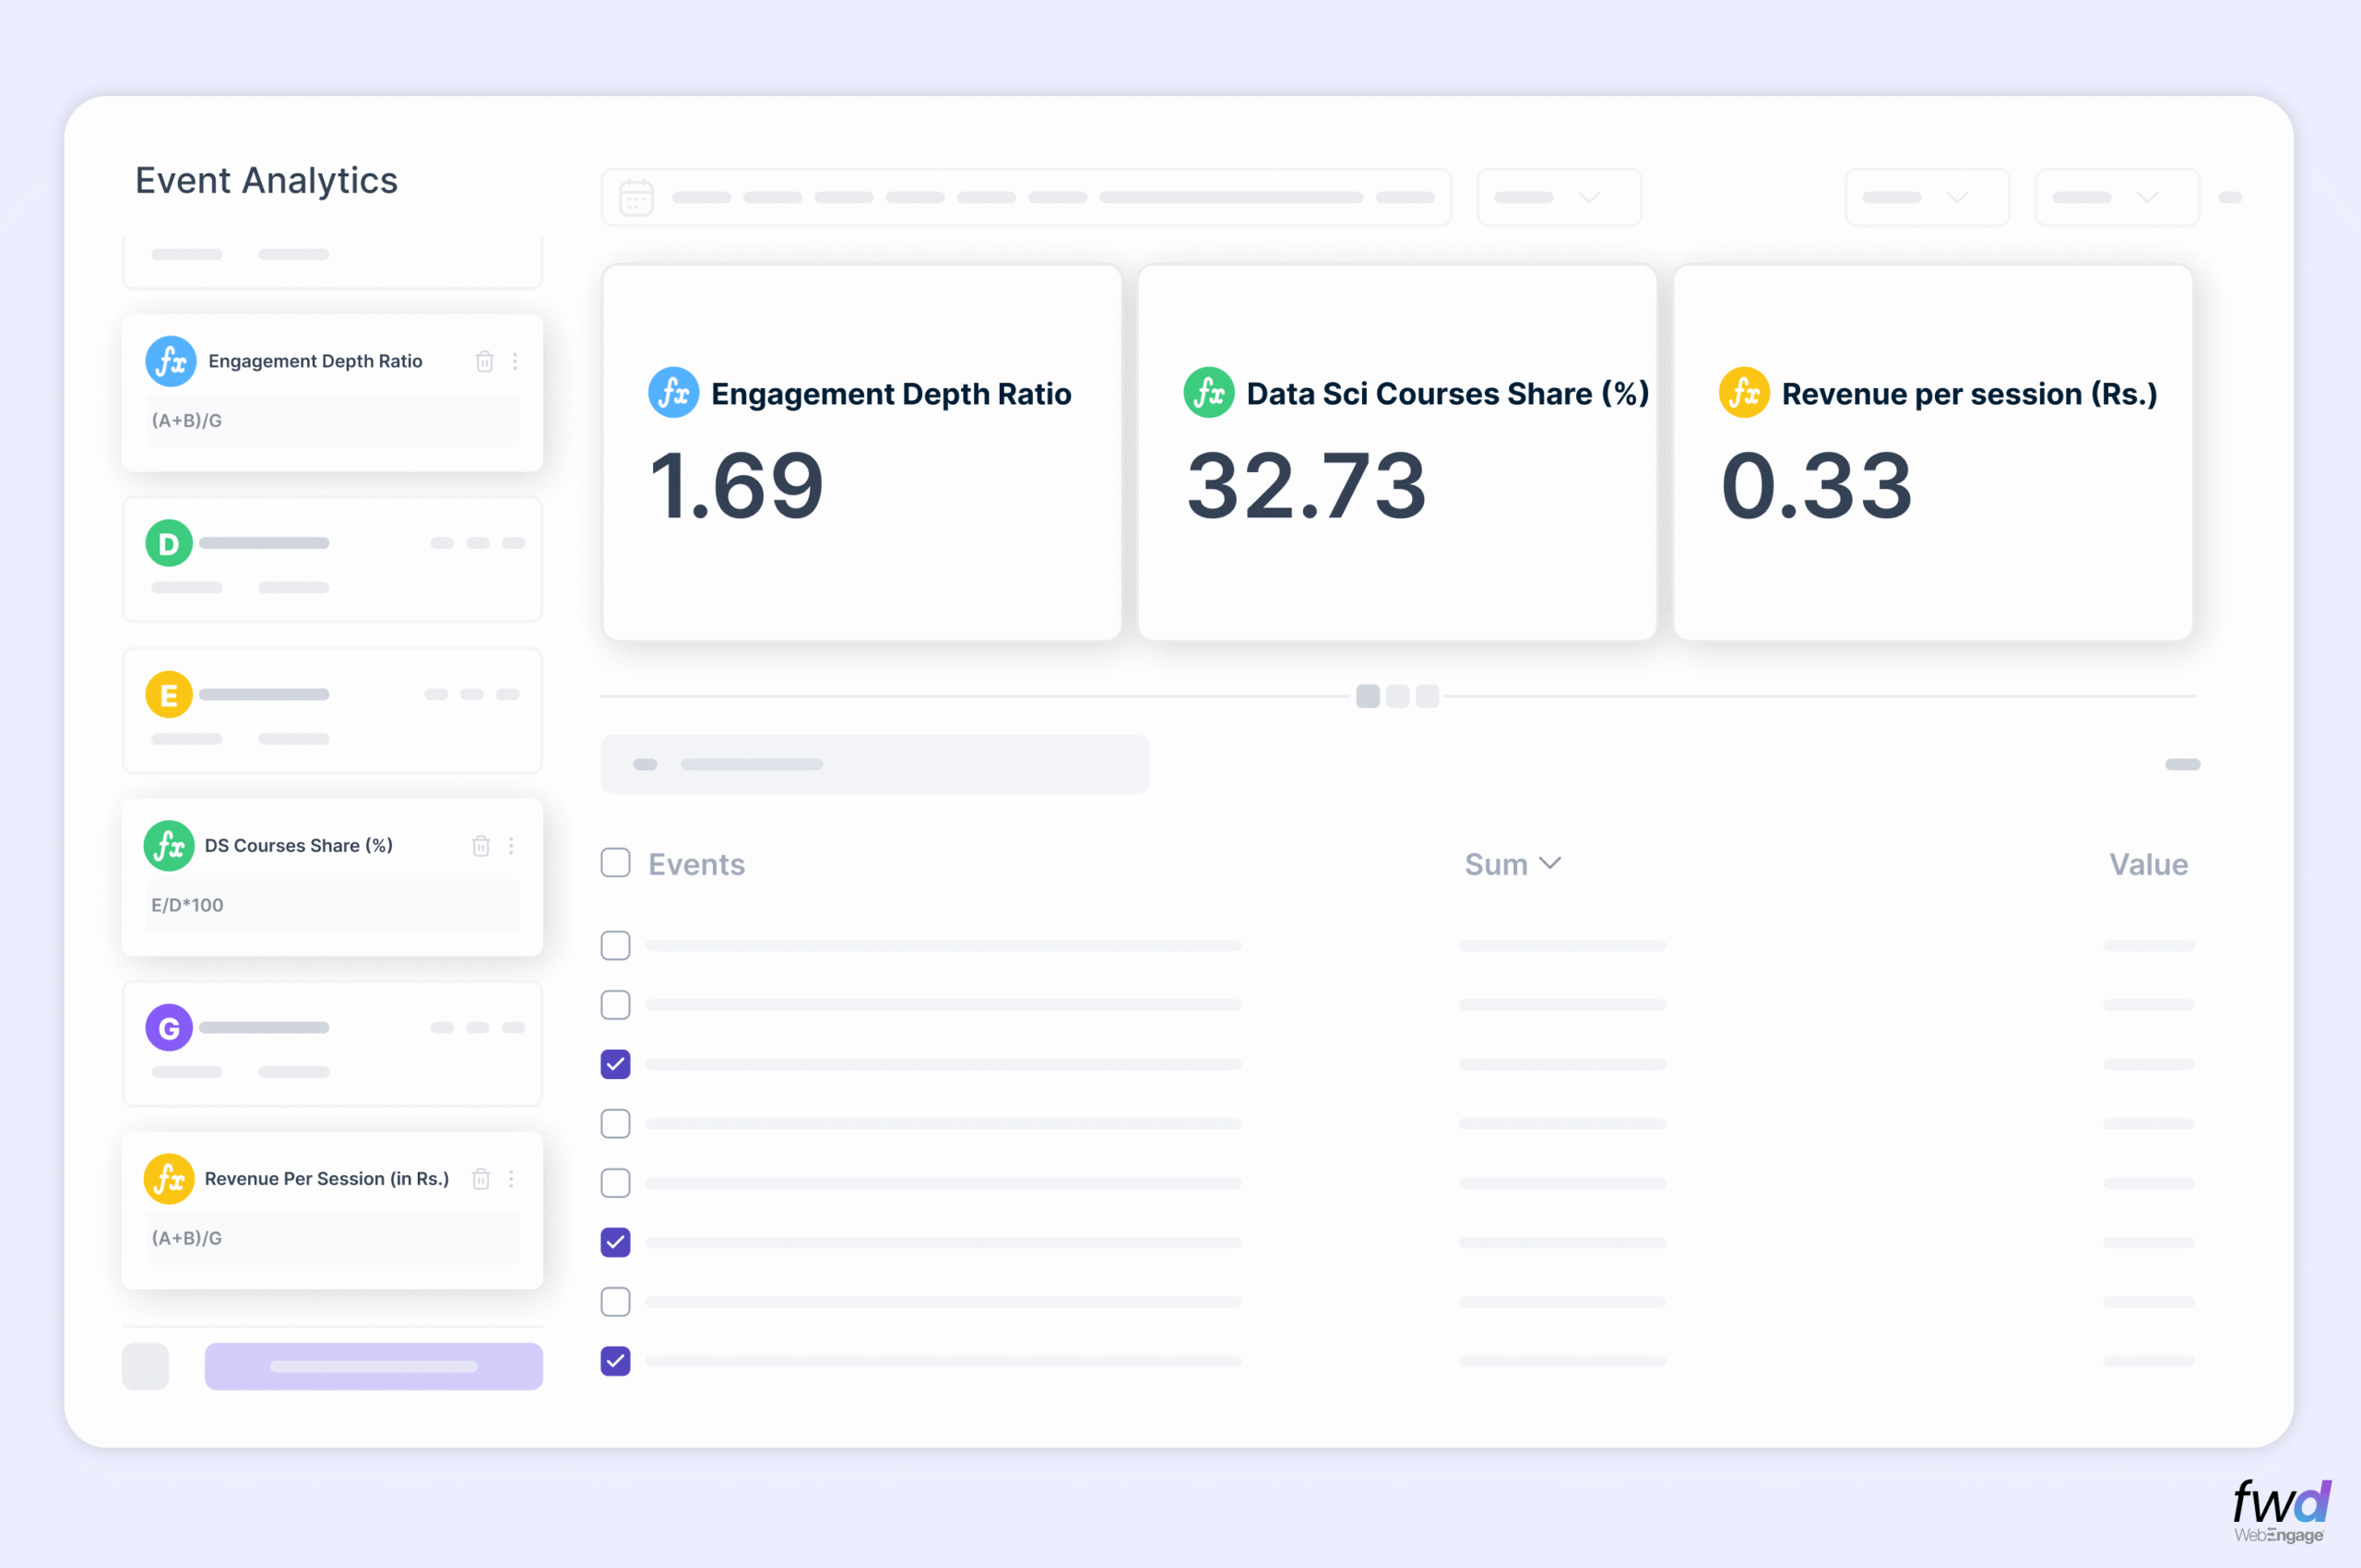
Give these formulas a try..
- Engagement Depth = Sum of (clicks + views + likes) / Total Sessions
- Category Share = Transaction in a particular category / Total Transactions
- Transaction-To-Campaign Ratio = Count of Transactions / Total Number Of Campaigns Received
Event and Funnel Analytics go hand in hand. We have recently revamped our Funnel experience and added the capability to split/compare funnels and view percentile distribution of conversions. Coupled with the above mentioned Event Analytics upgrades, that’s a whole lot of power in your hands now!
I recommend this for your leisure reading – A comprehensive guide to WebEngage Event Analytics
The revamped Event Analytics interface is rolled out for almost all of our customers. If you still see the older version, please make a request to switch to the new avatar from within your dashboard.


 Ananya Nigam
 Surya Panicker
 Ajit Singh
 Harshita Lal
 Priyam Jha